Qualify: How to View Executive Summary Report

This report provides a summary of key features related to the department’s performance, offering management a concise overview without the need to review each individual report in detail.


1. On the Dashboard landing page, click the “QUALIFY” button to proceed
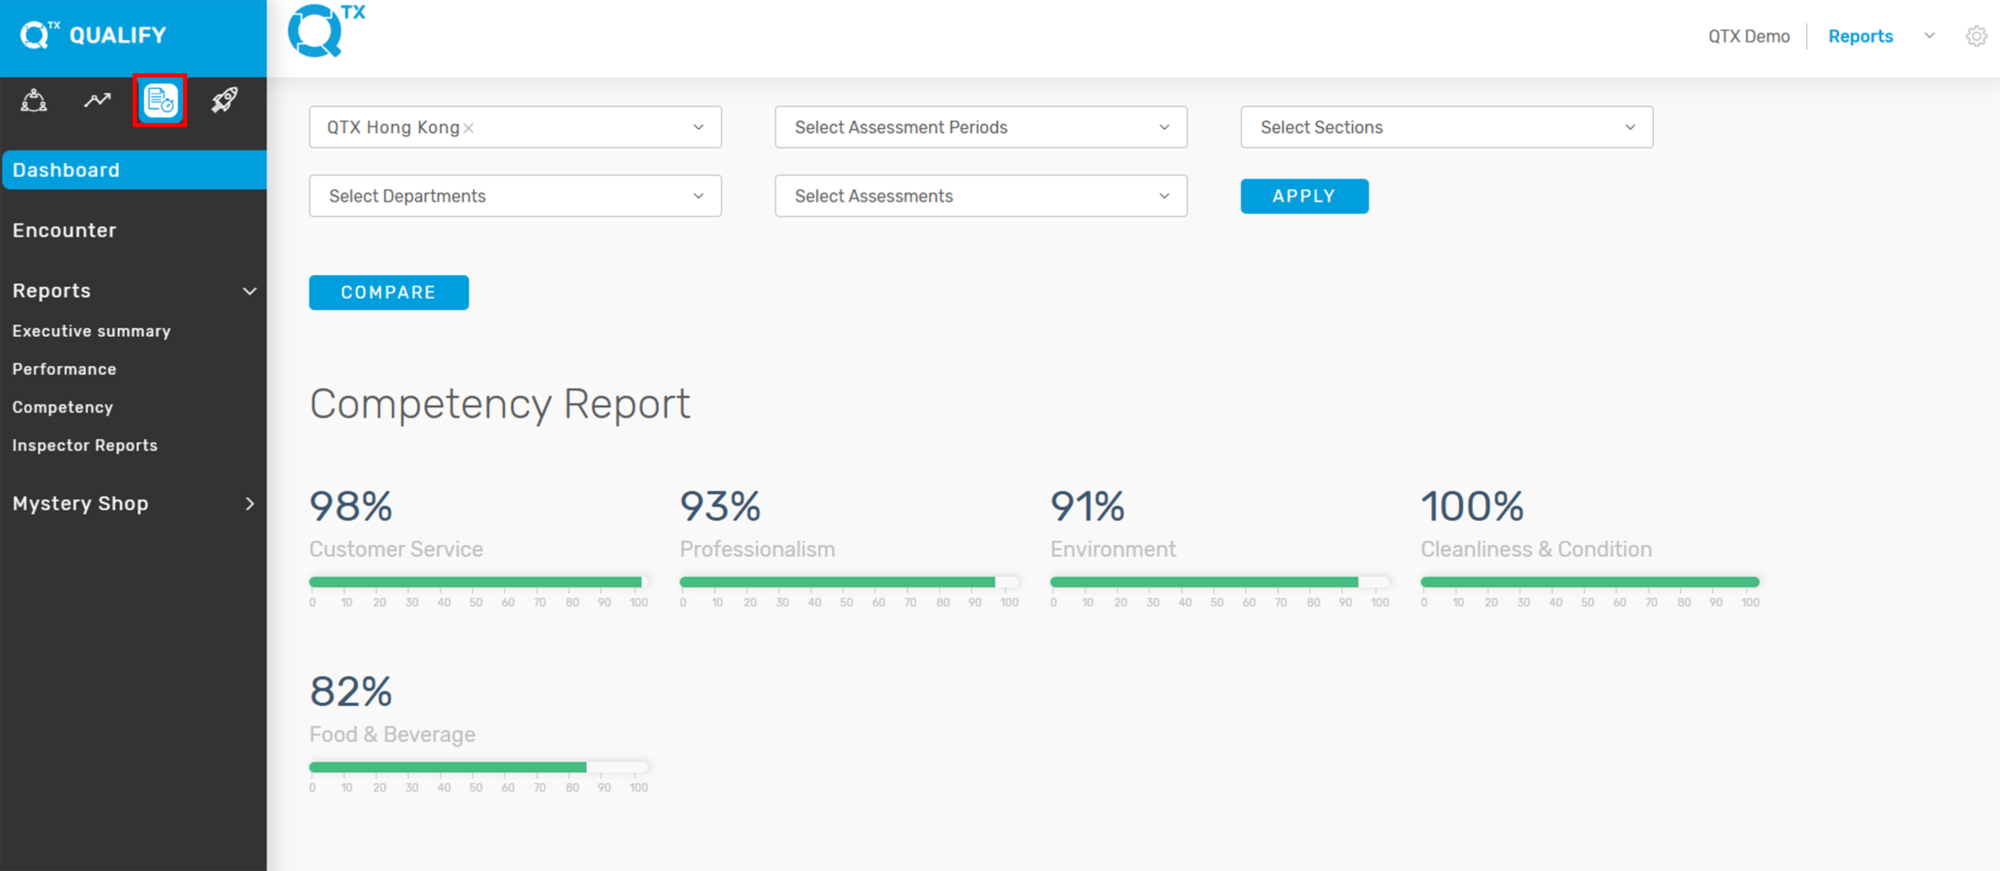
 

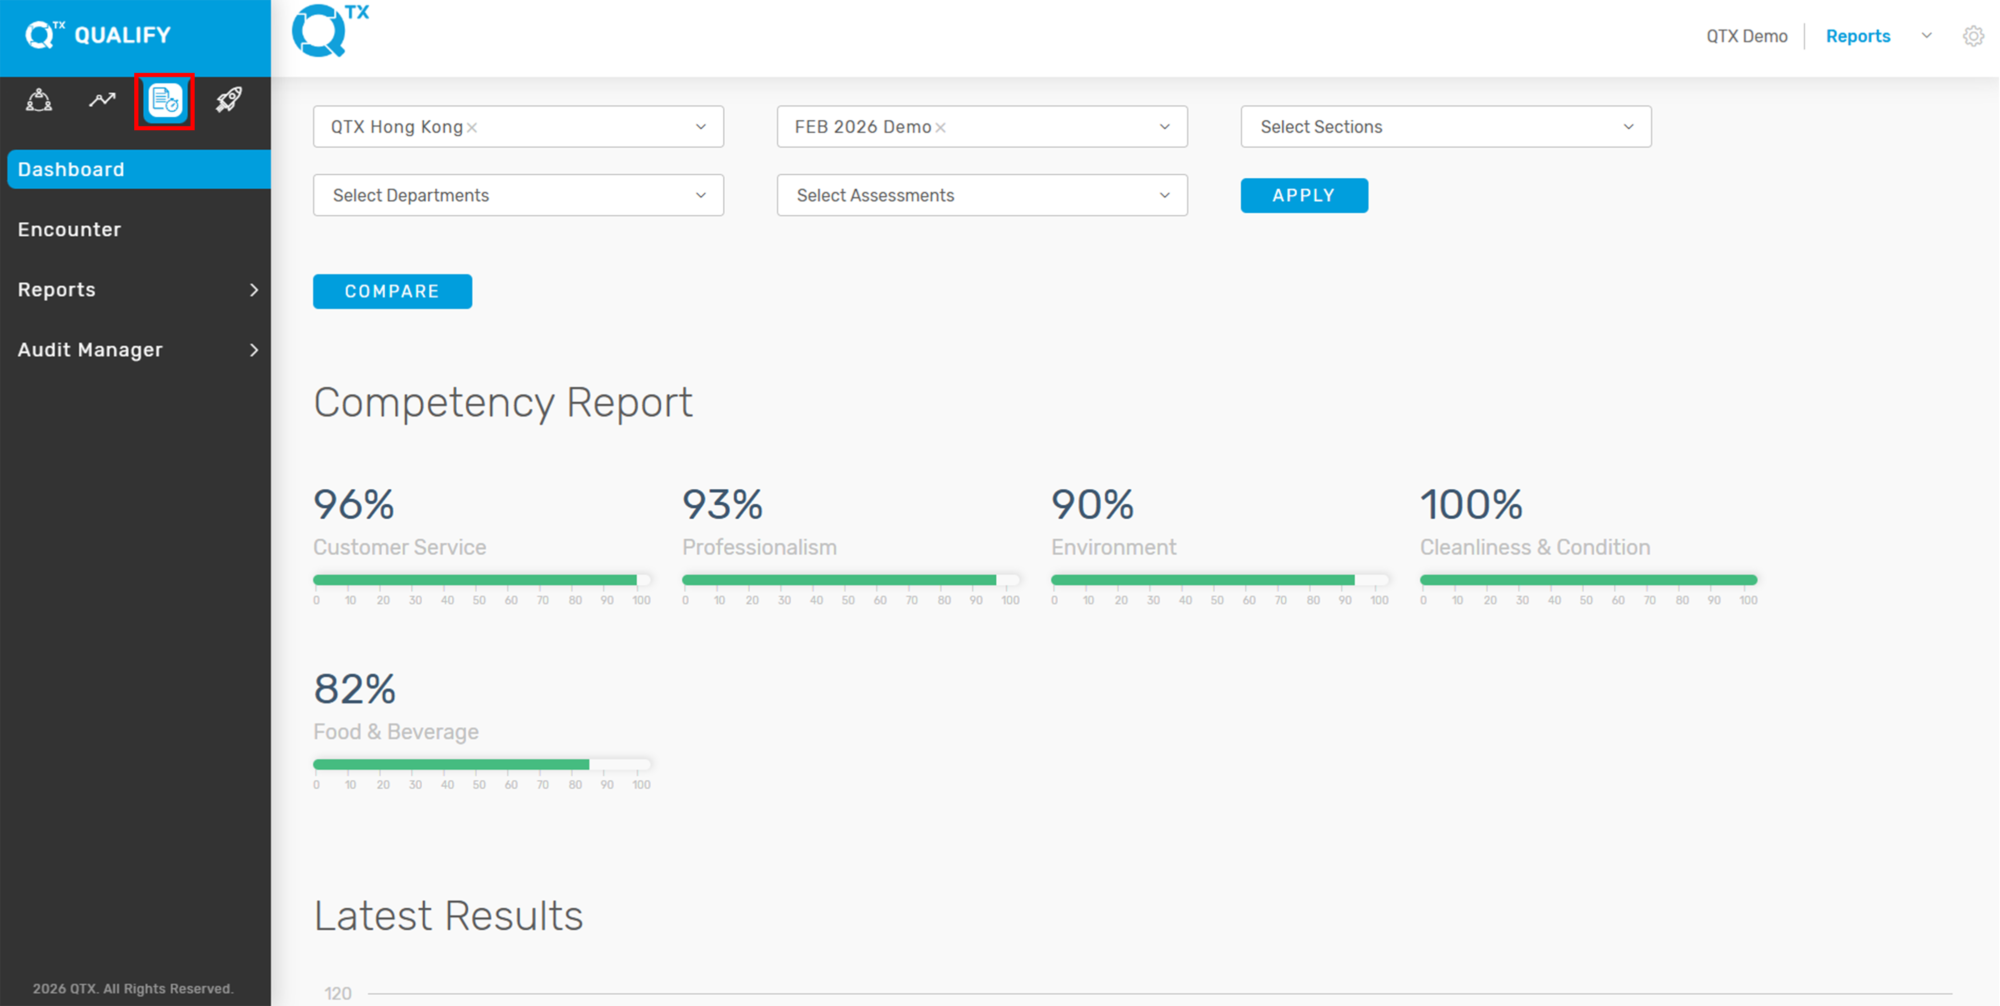
2. Click on the ‘Executive Summary’ button under the ‘Reports’ section, then complete the required details using the available filters.


3. This Image displays key competency metrics such as Customer Service and Professionalism, along with a Performance Summary chart that visually compares overall performance scores, such as Hotel Services. This section provides a quick and clear overview of team and department performance.


4. The chart indicates how many percentages are achieved, not achieved, and N/A. This summary helps users quickly assess performance outcomes. Below the chart, there’s a section labeled Summary Comments where detailed observations or feedback can be added.


If you need further assistance, please send an email to helpdesk@q-tx.com
Qualify: How to View Number of Missed Standards Report by Competency

This displays the total number and percentage of missed standards, categorized by Competency, helping to identify areas needing improvement.


1. On the Dashboard landing page, click the “QUALIFY” button to proceed.


2. Click the “Reports” button from the navigation menu, then select “Competency” to view performance data.


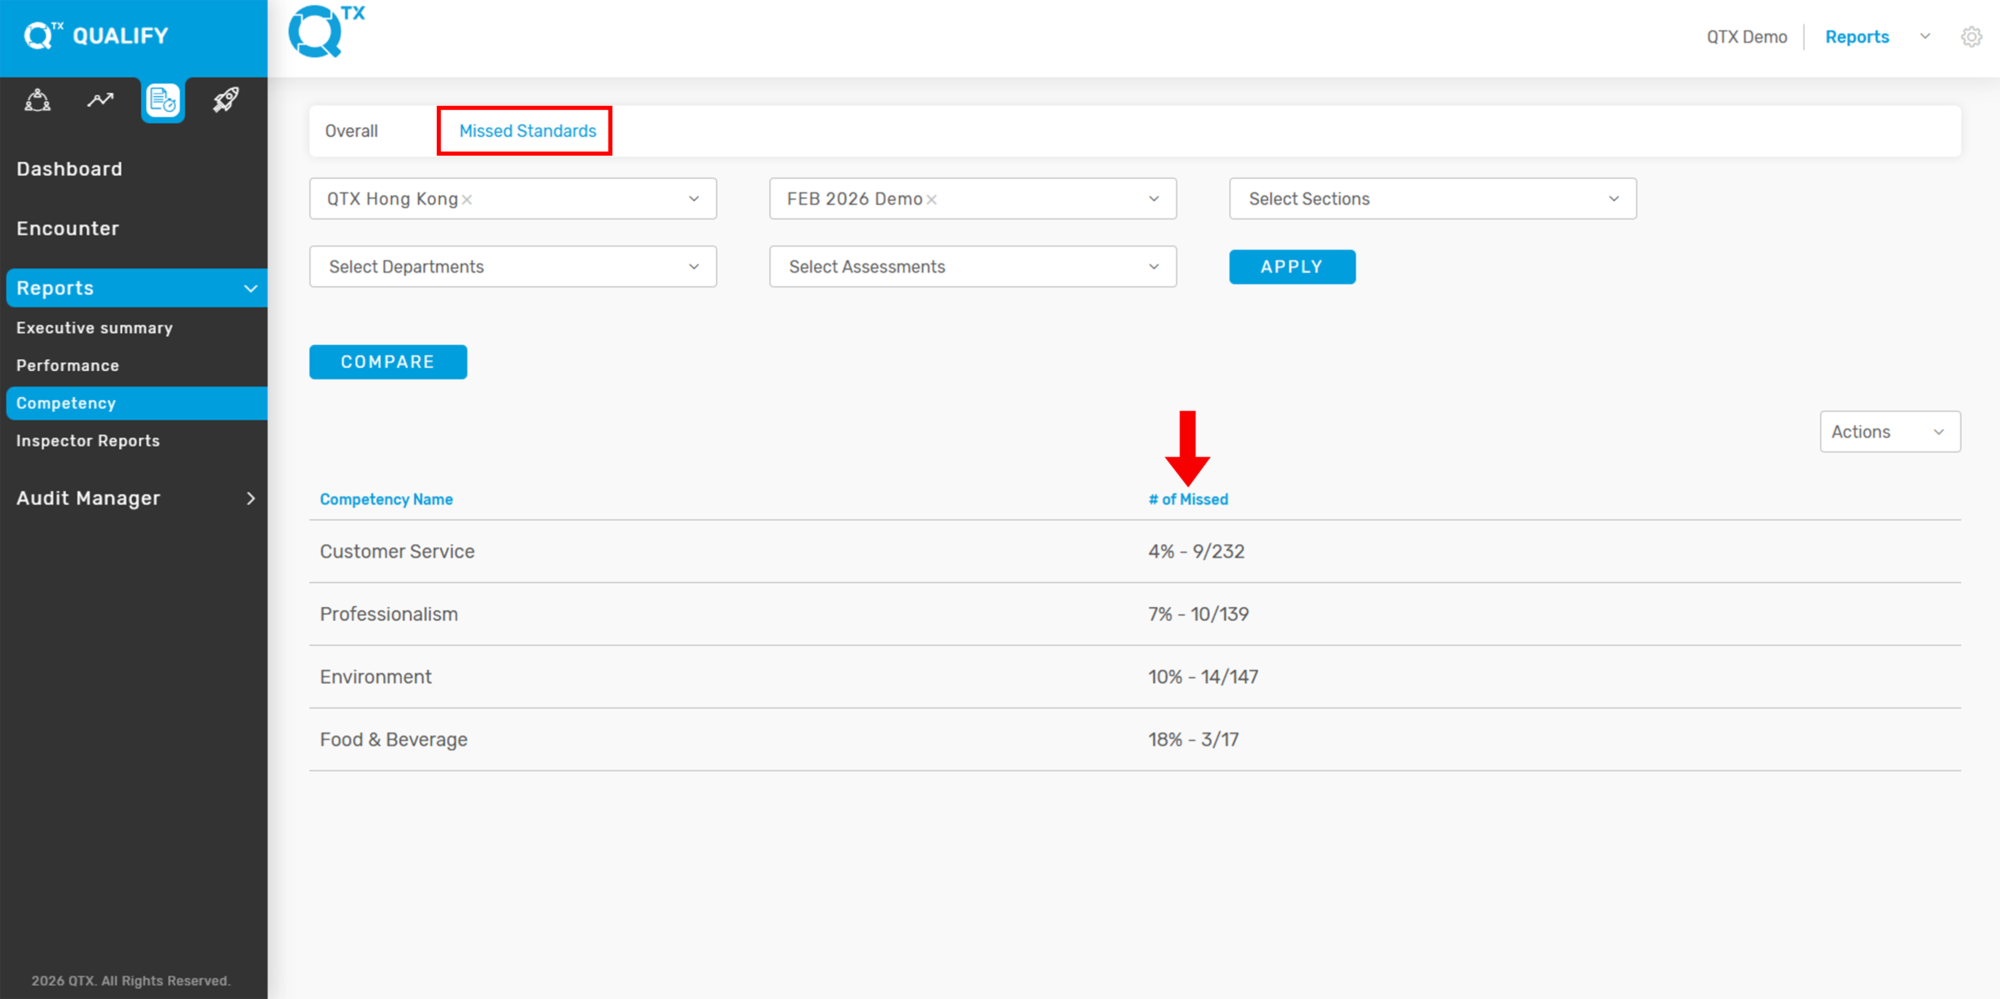
3. Click on the “Missed Standards” tab, then select the relevant filters from the available options. From here, you will be able to see the number of Missed Standards based on the selected criteria.


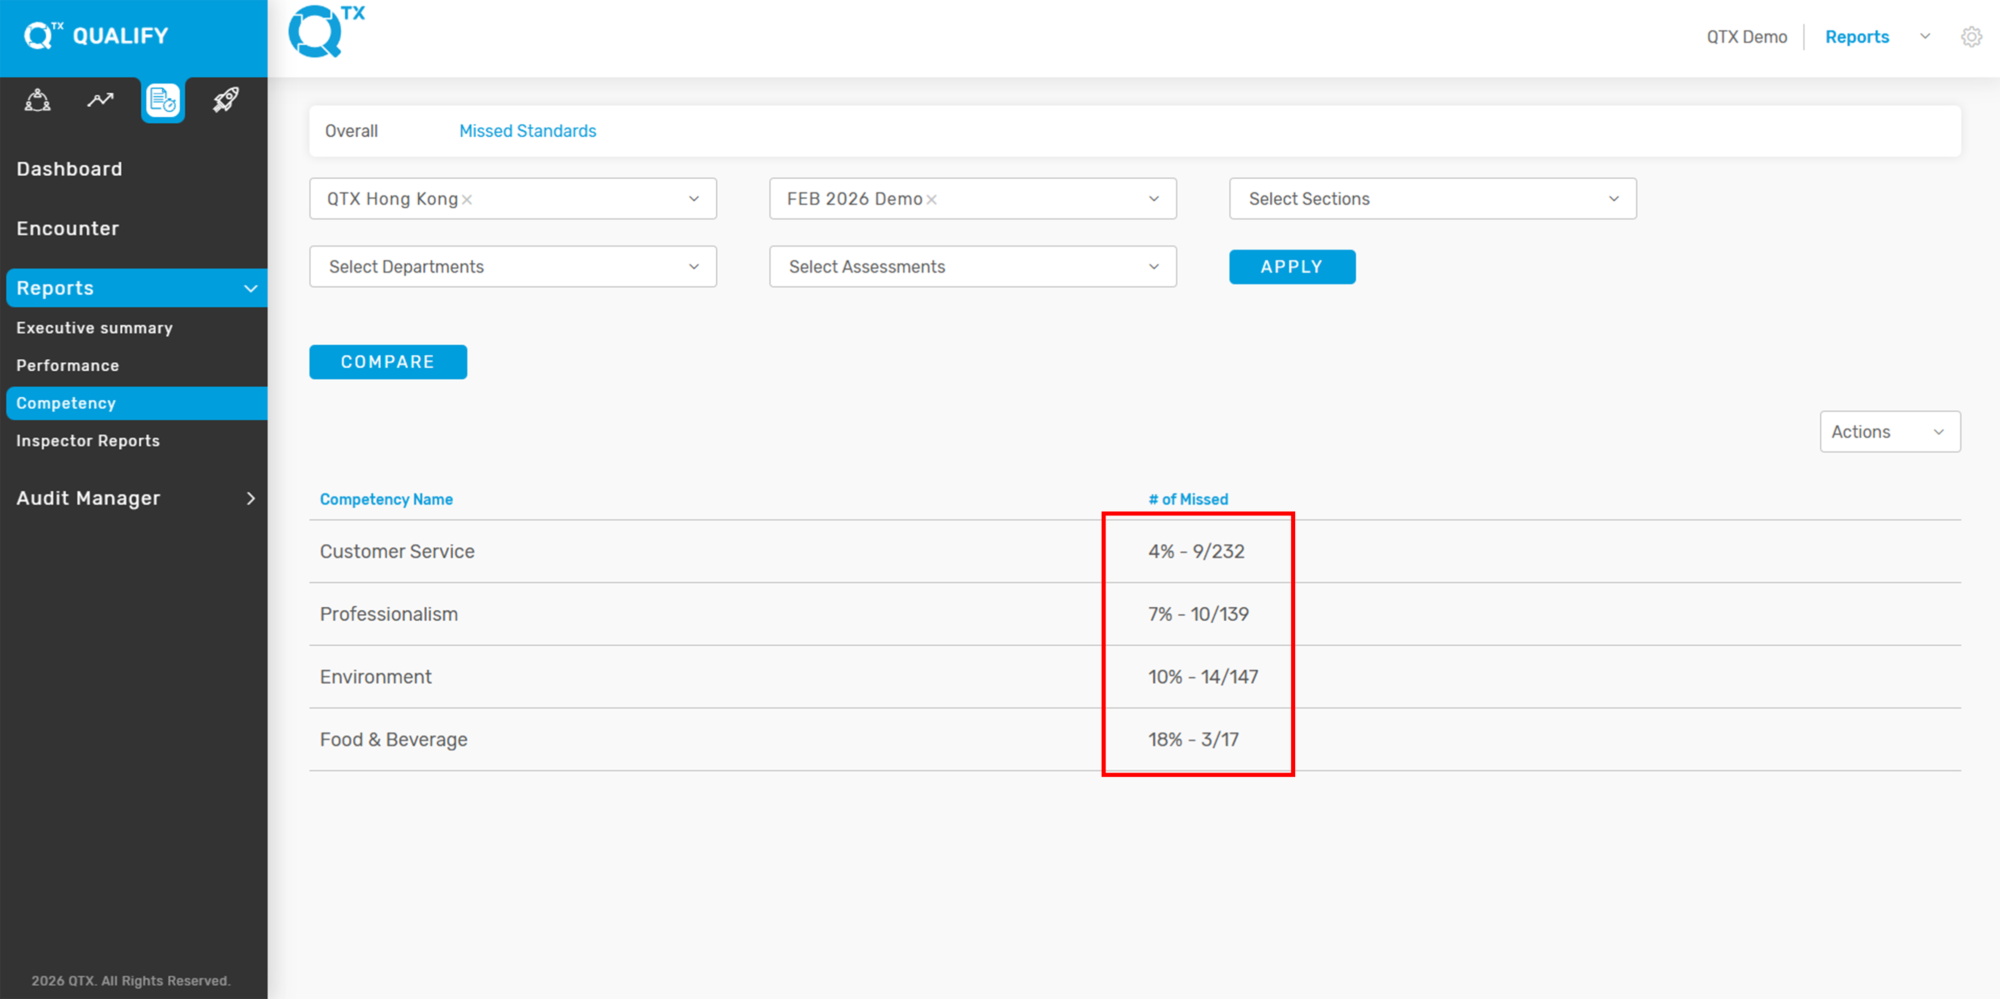
4. The report will display the missed standards categorized by Competency, showing both the number of missed items and their corresponding percentage. This helps identify specific areas needing improvement.


5. Click any of the Competency Names to display a detailed list of the missed standards under that specific competency, as shown in the example below. This allows users to pinpoint which standards were not met.


If you need further assistance, please send an email to helpdesk@q-tx.com
Qualify: How to View Overall Competency Report

Each standard reflects a category of inspector feedback/experience, known as a Competency and Subcompetency/Segment. This report presents the details of the Competency Report by location, section, and department. Classifying the information accordingly will make it easier for the user to understand overall performance.


1. On the Dashboard landing page, click the “QUALIFY” button to proceed.


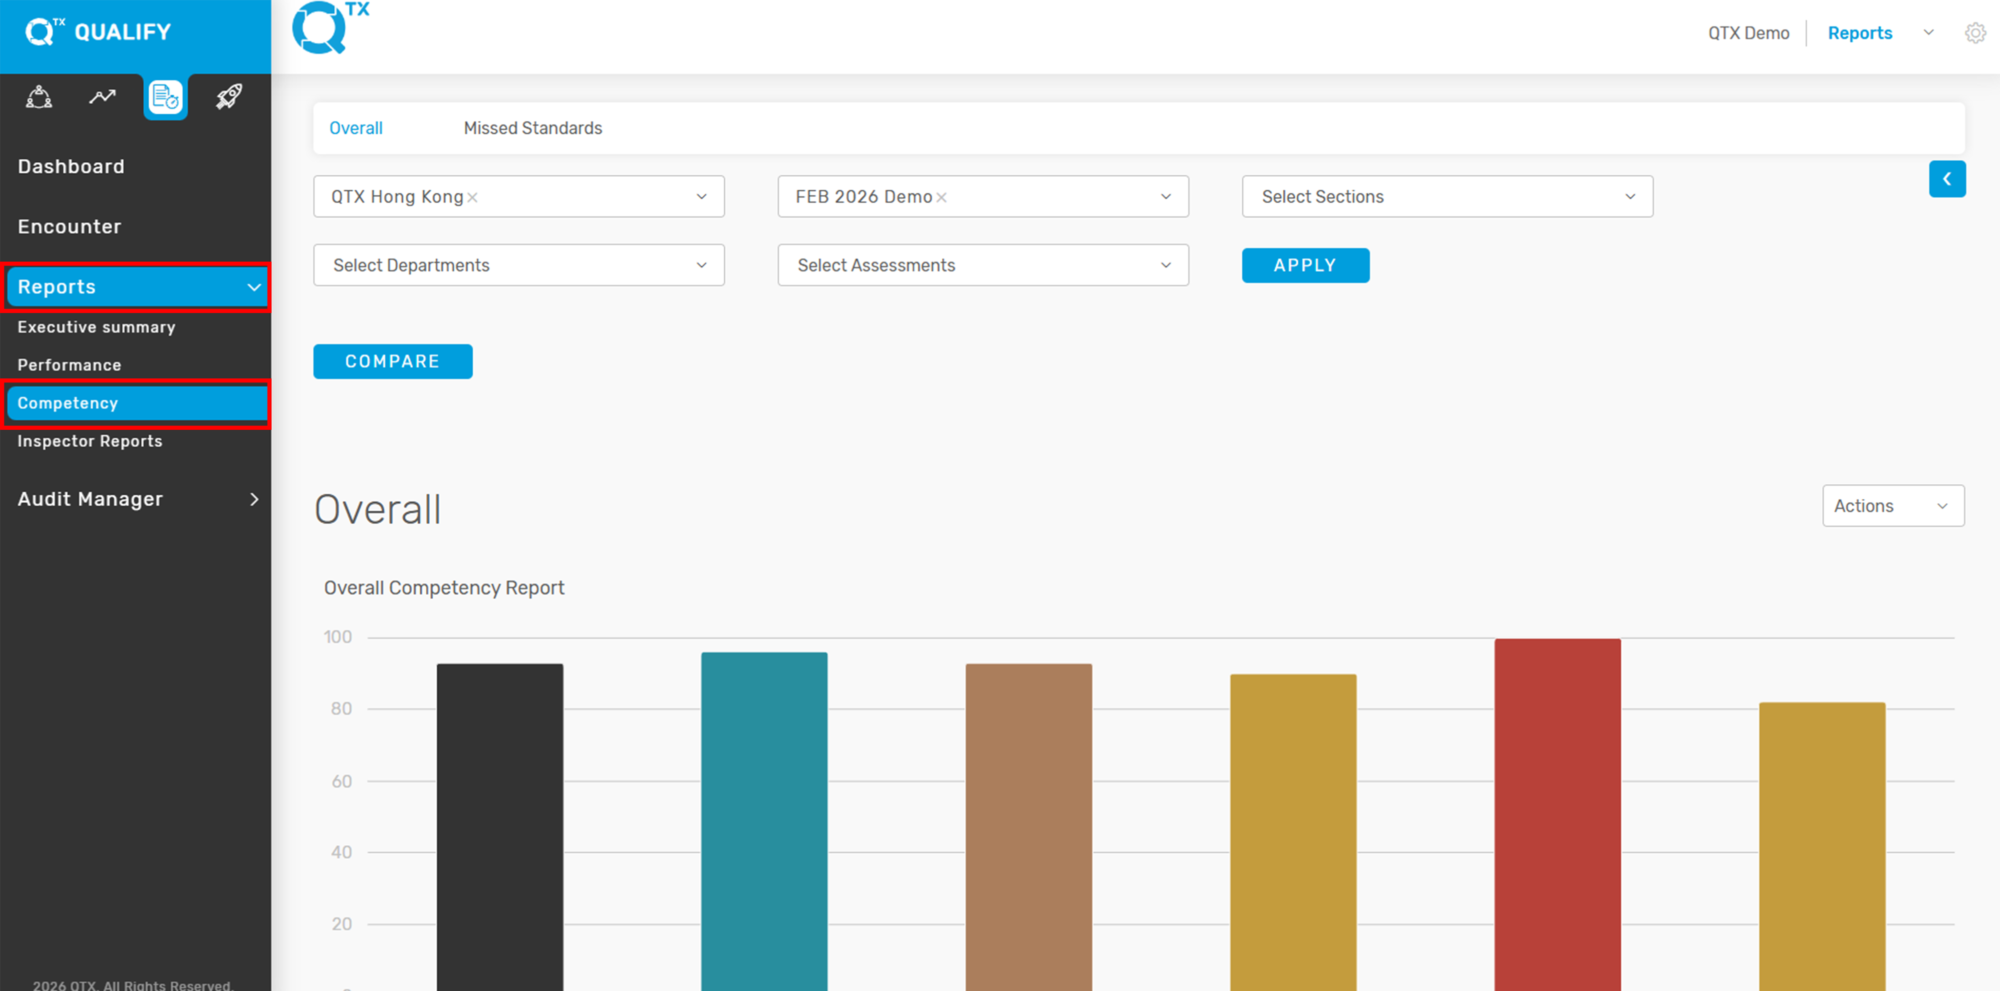
2. To access the Competency Report, start by clicking the “Reports” button located on the main navigation menu. From the dropdown options that appear, select “Competency” to view the detailed report related to inspector feedback and performance metrics.


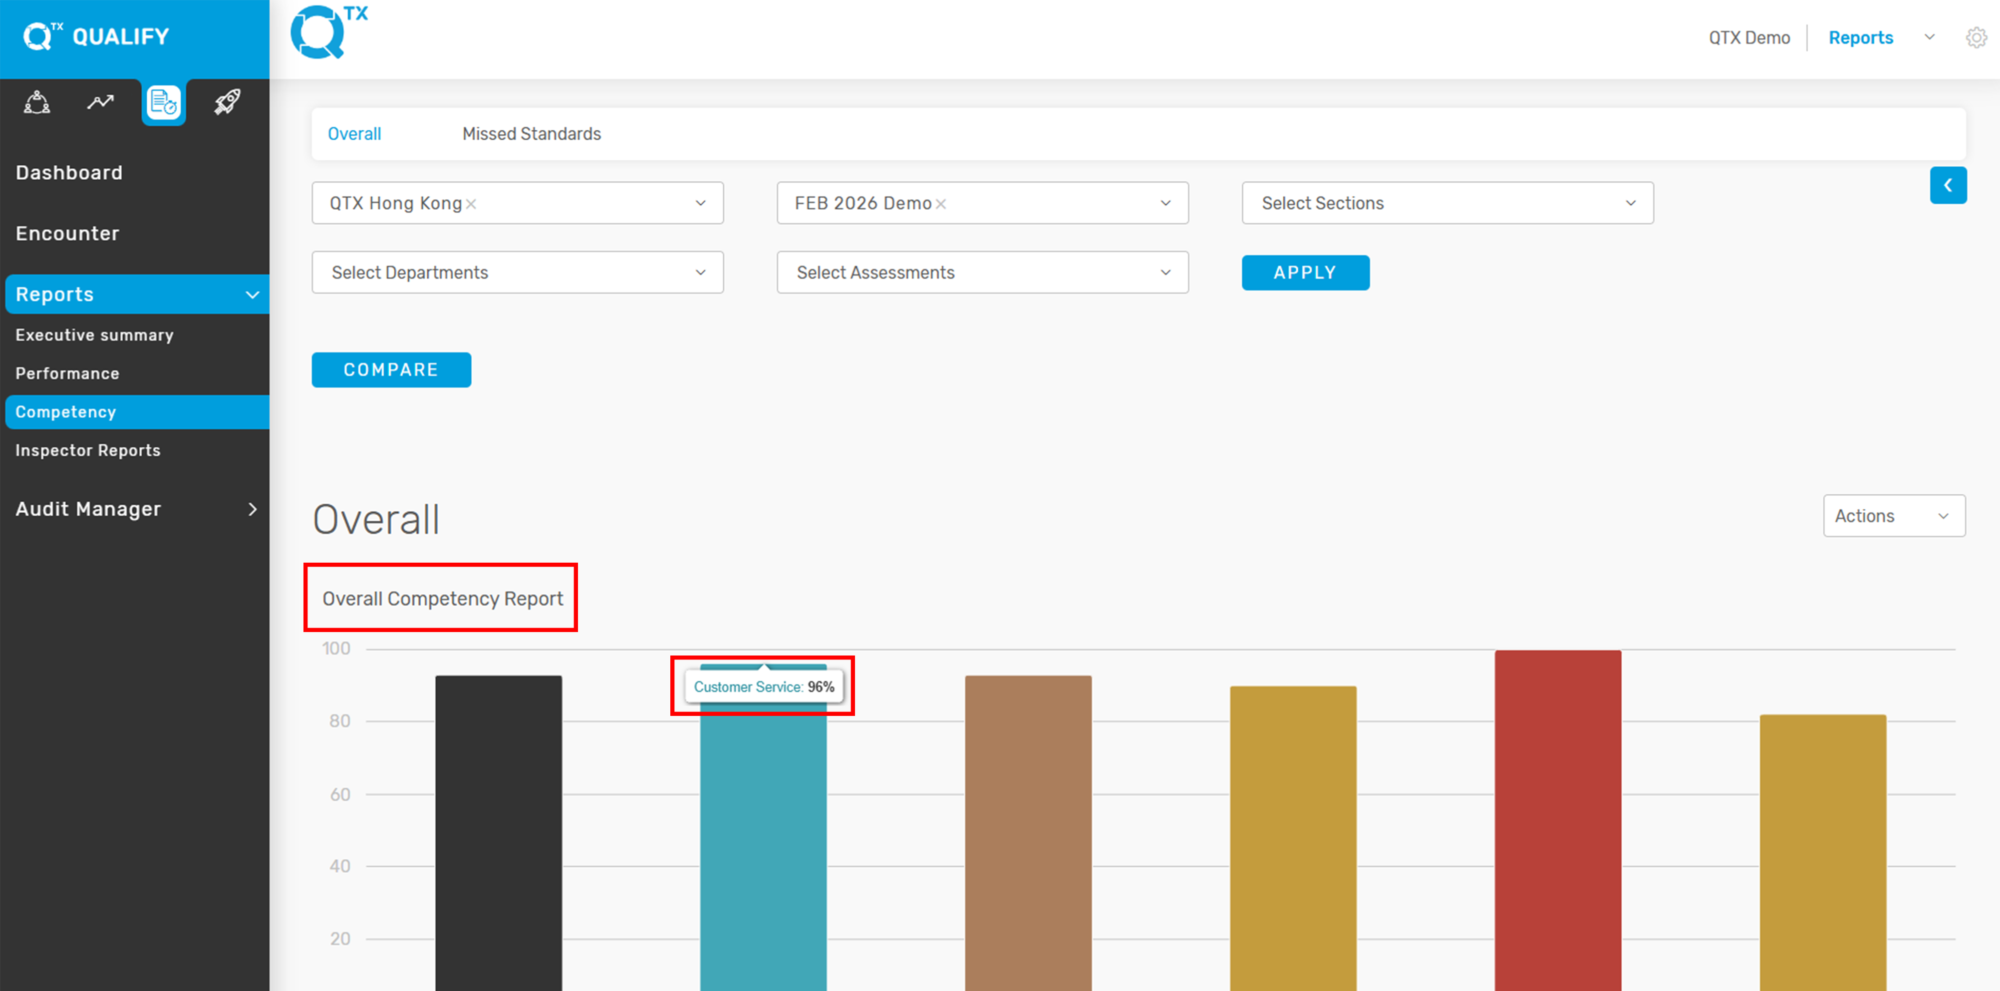
3. Ensure that you are on the “Overall” tab before proceeding. From there, use the selection list to filter and choose the relevant information you wish to view, and clickthe  “Apply” button.


4. The Overall Competency Report will be displayed as a graph. To view the percentage score for each category, simply point your cursor at the specific graph bars.


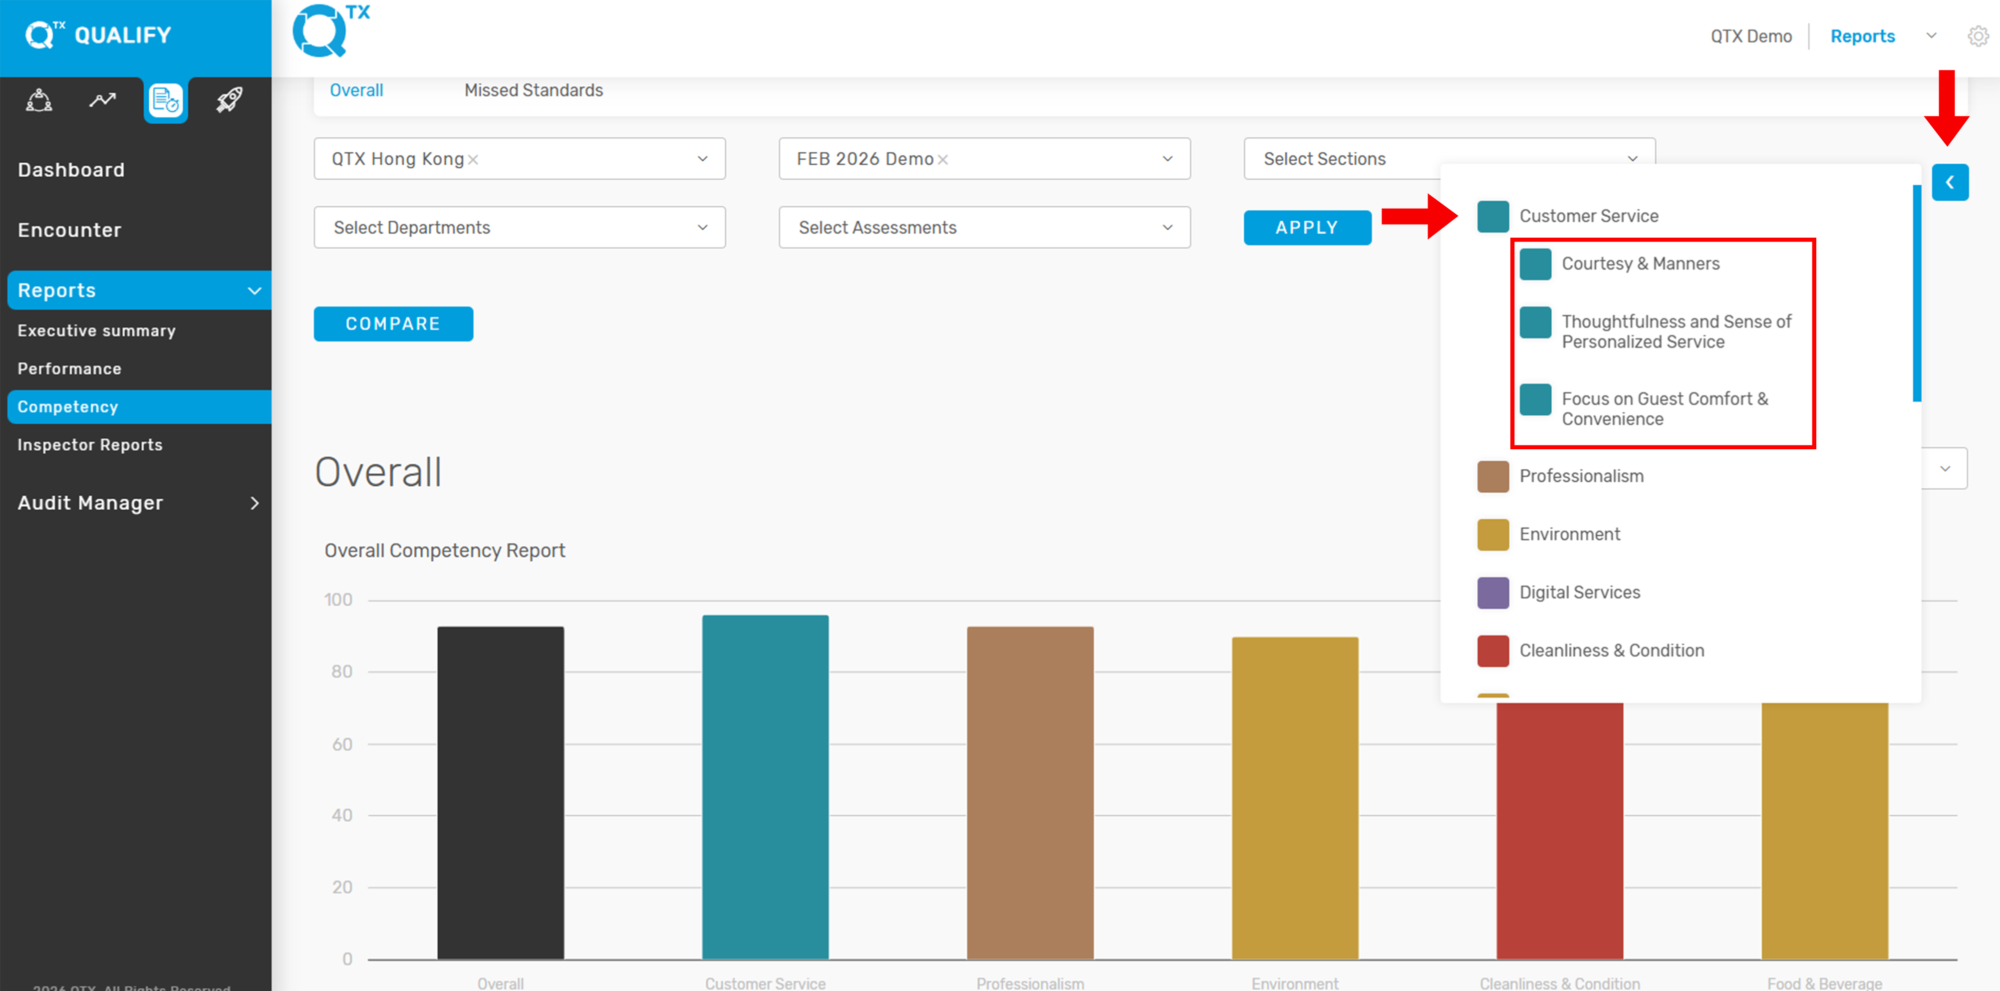
5. Click the “Arrow” button to show or hide the Competency list. Then, click on the colored box items within the list to view the corresponding Subcompetency or Segment name, if available.


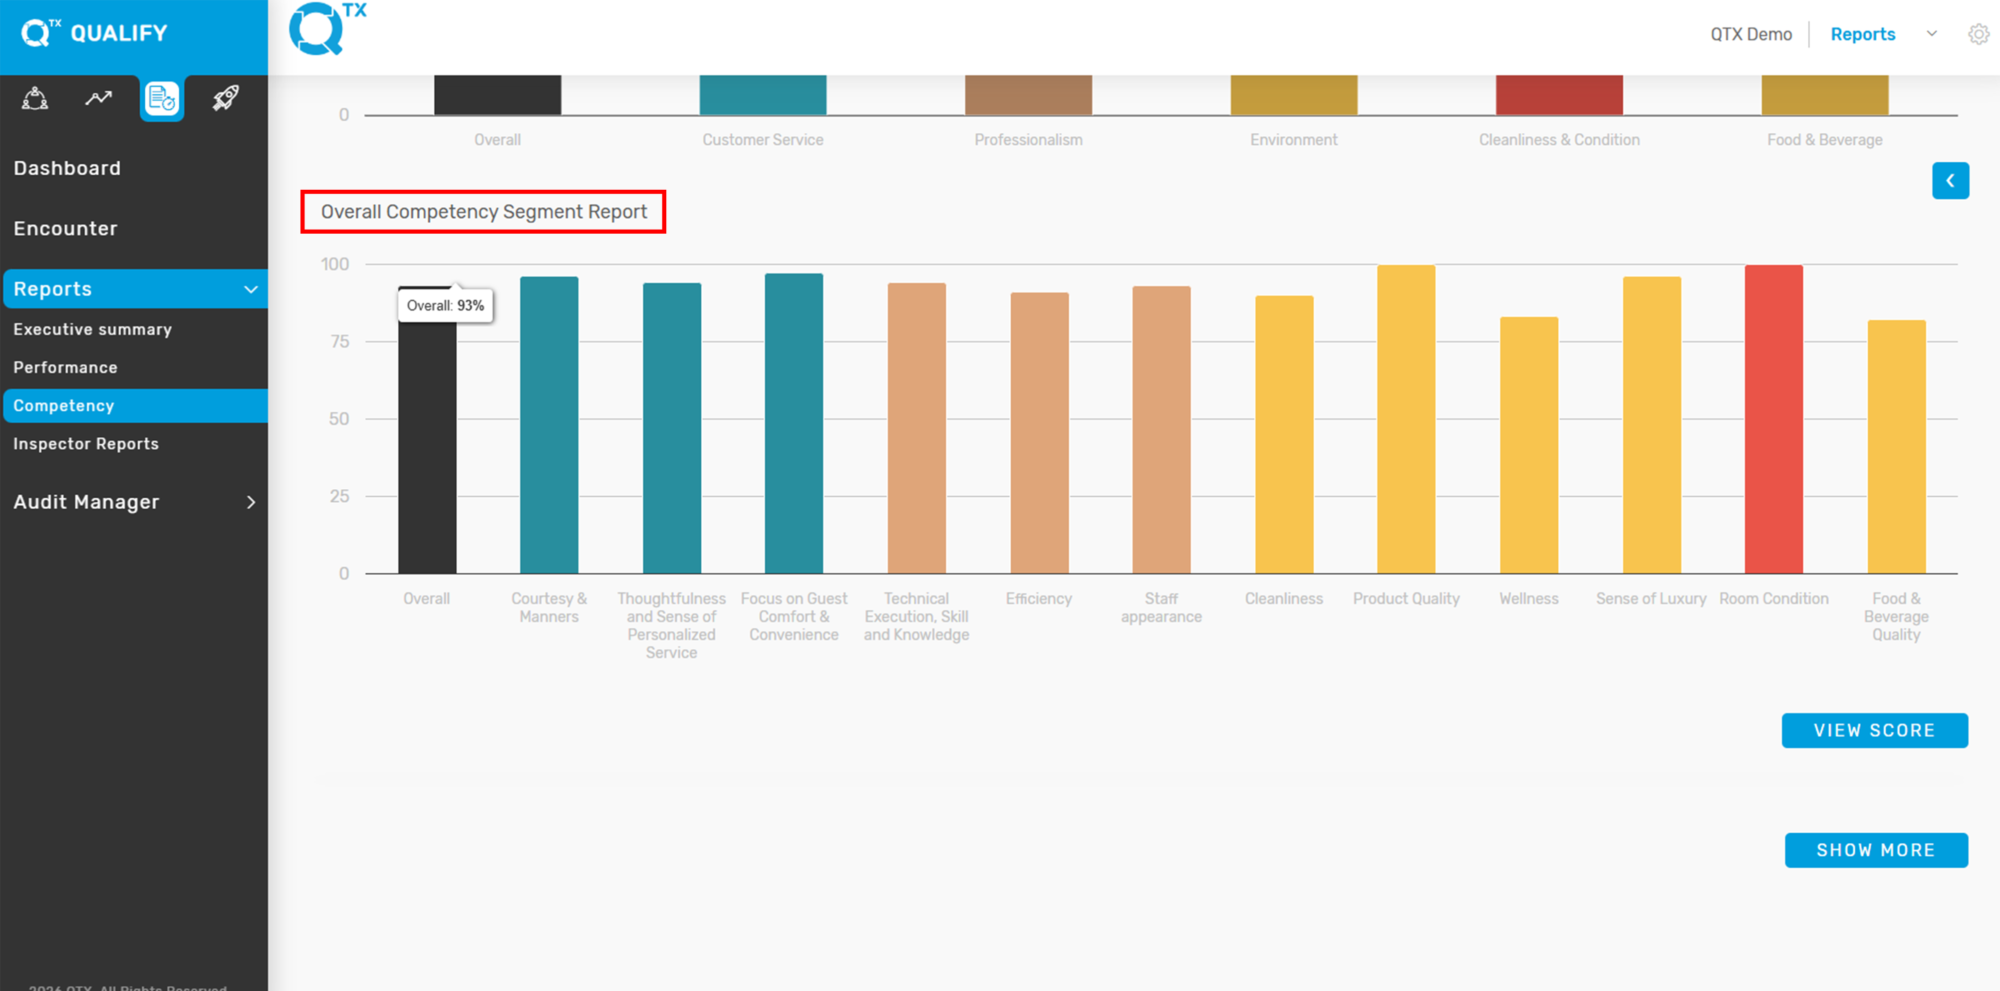
6. Below is the Overall Competency Segment Report, which provides a breakdown of performance across various segments.


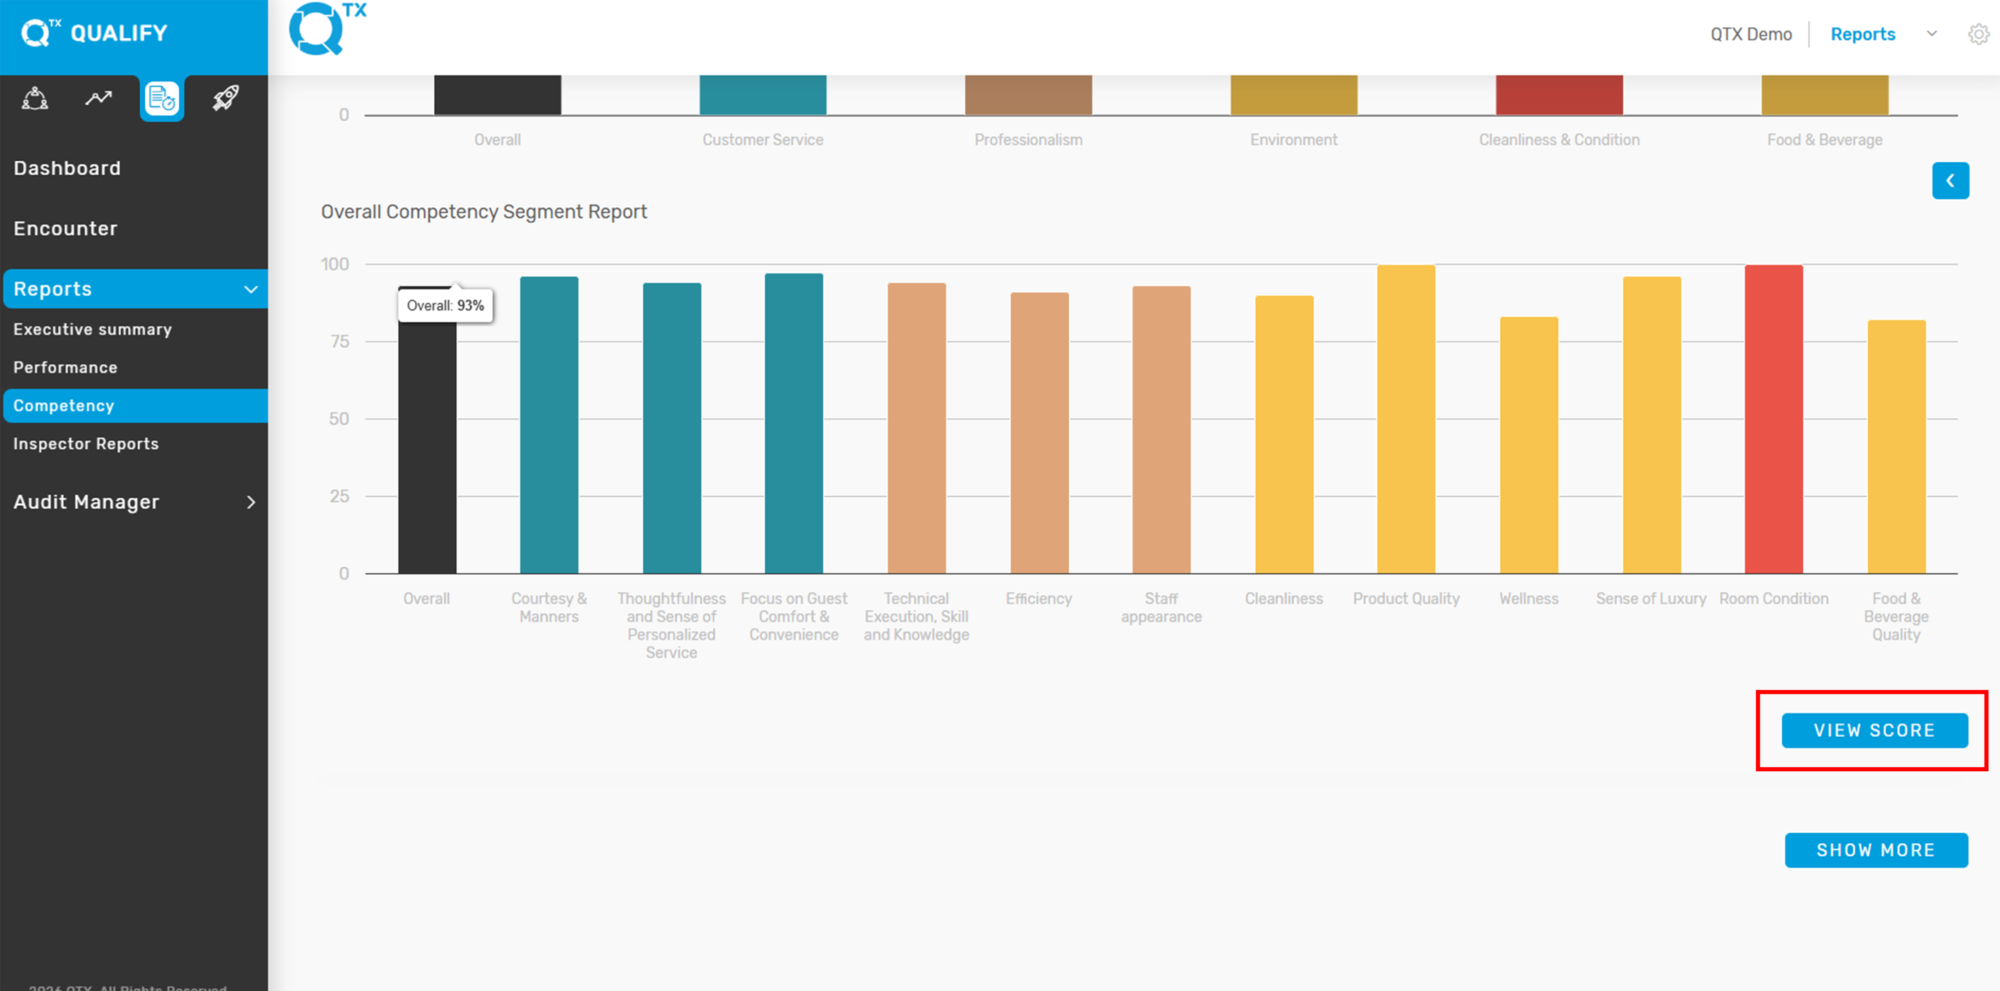
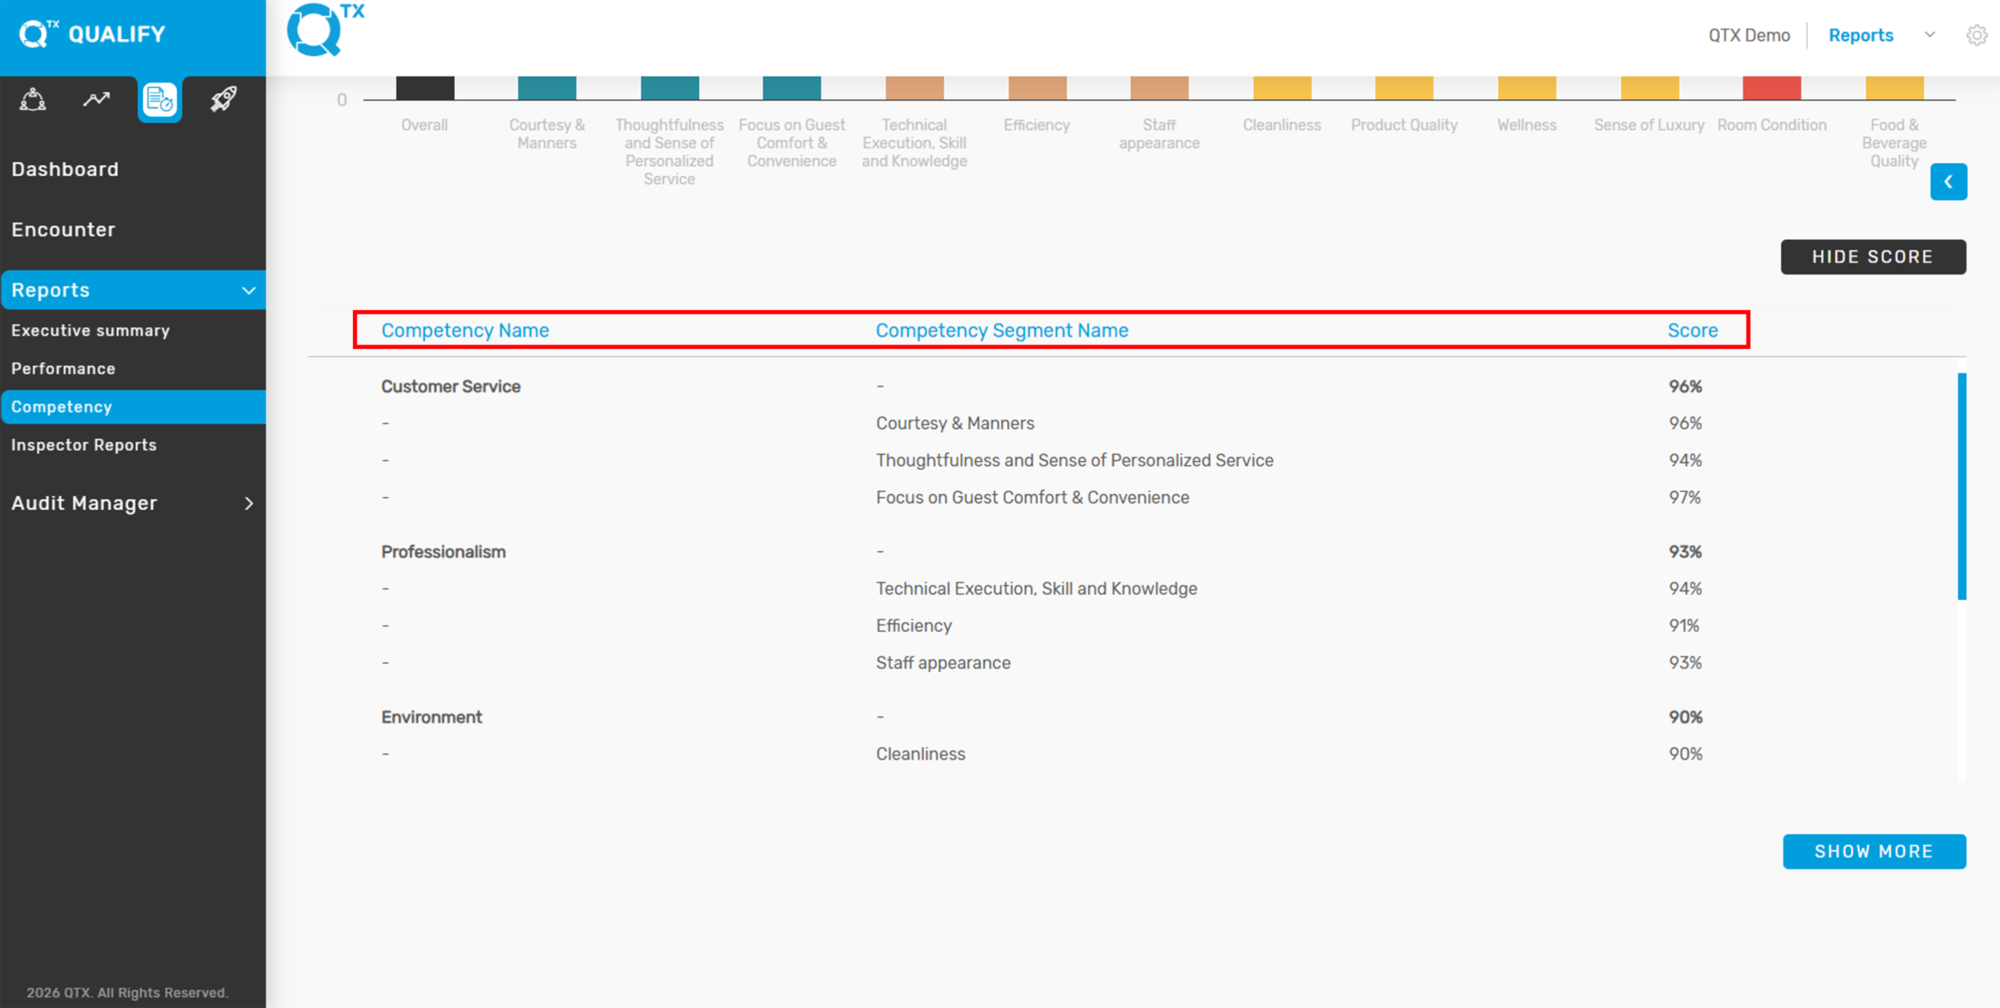
7. Click the “VIEW SCORE” button to display the scores categorized by Competency and Competency Segment Name.


8. From here, you can view the Competency Name, Competency Segment Name, and their corresponding scores.


If you need further assistance, please send an email to helpdesk@q-tx.com
Qualify: How to View Number of Missed Standards Report in Performance

This displays the number and percentage of missed standards for a department and/or section, based on the selected Assessment Name.


1. On the Dashboard landing page, click the “QUALIFY” button to proceed.


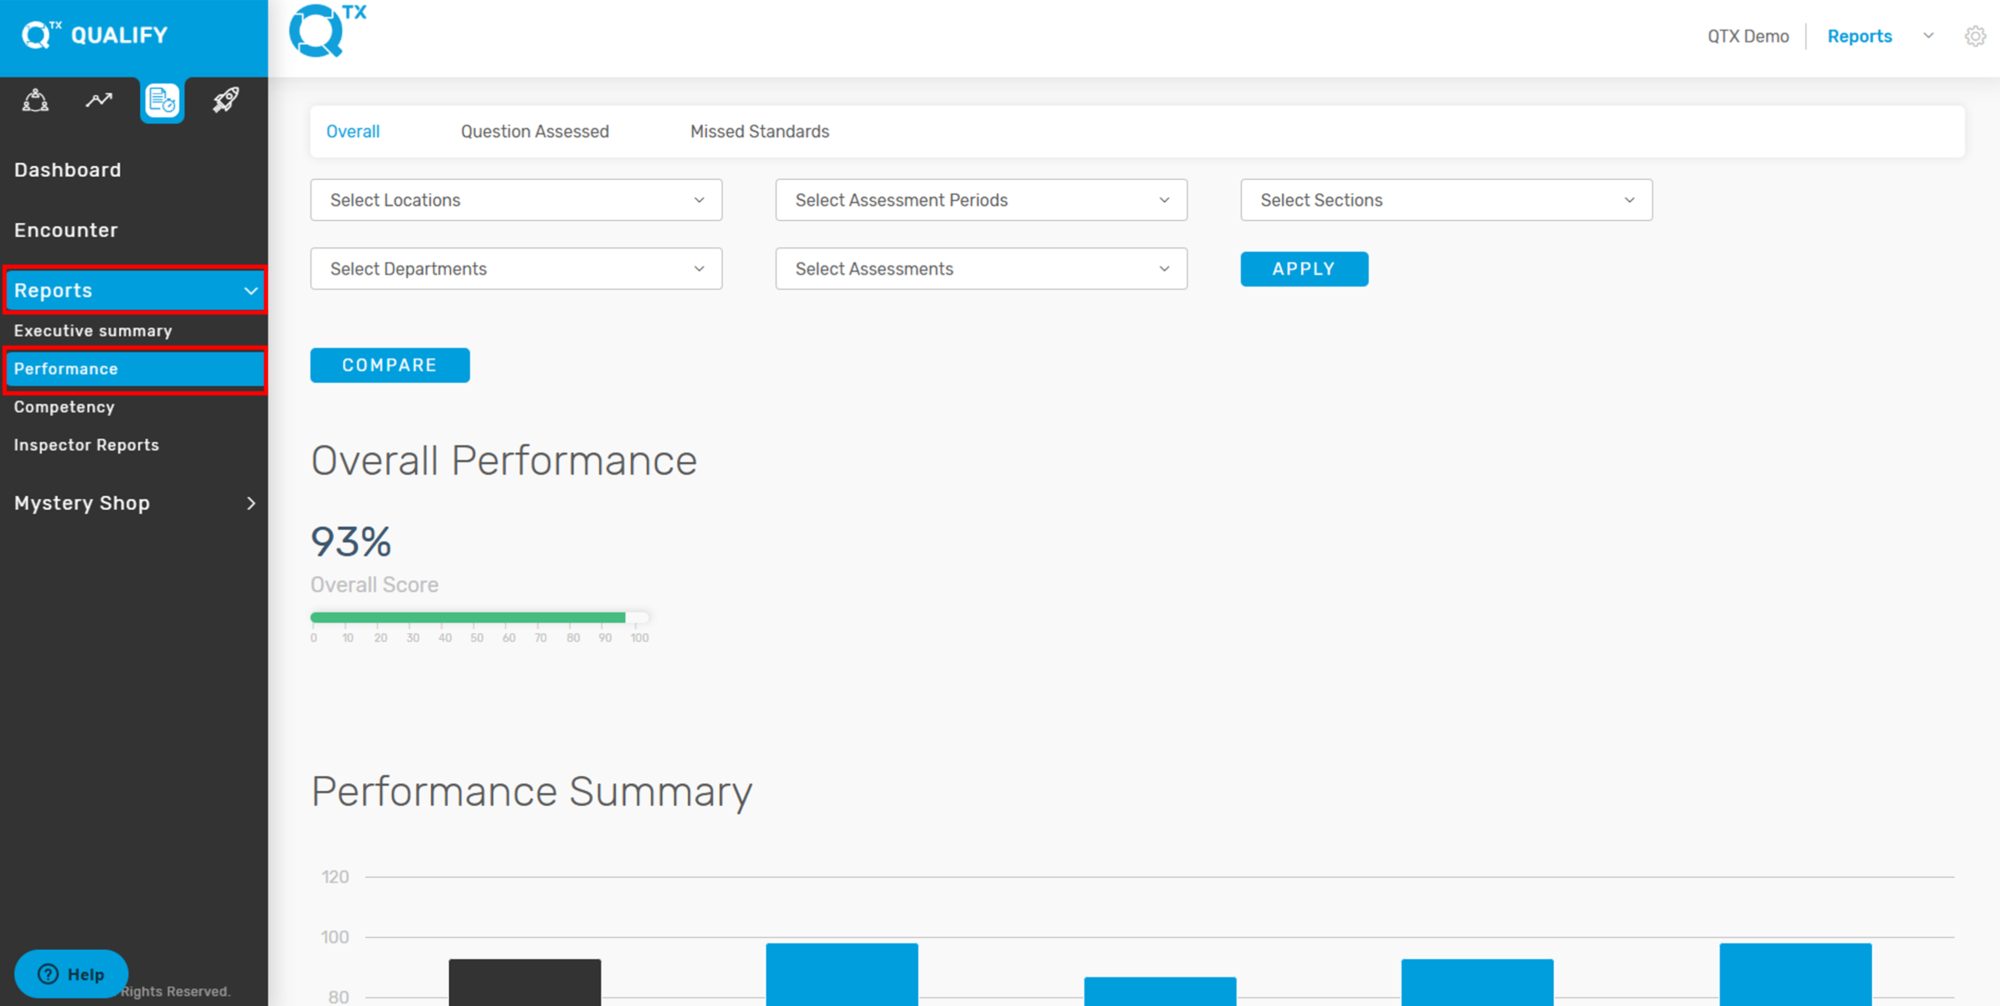
2. Click the “Reports” button, then select “Performance” from the dropdown menu to proceed.


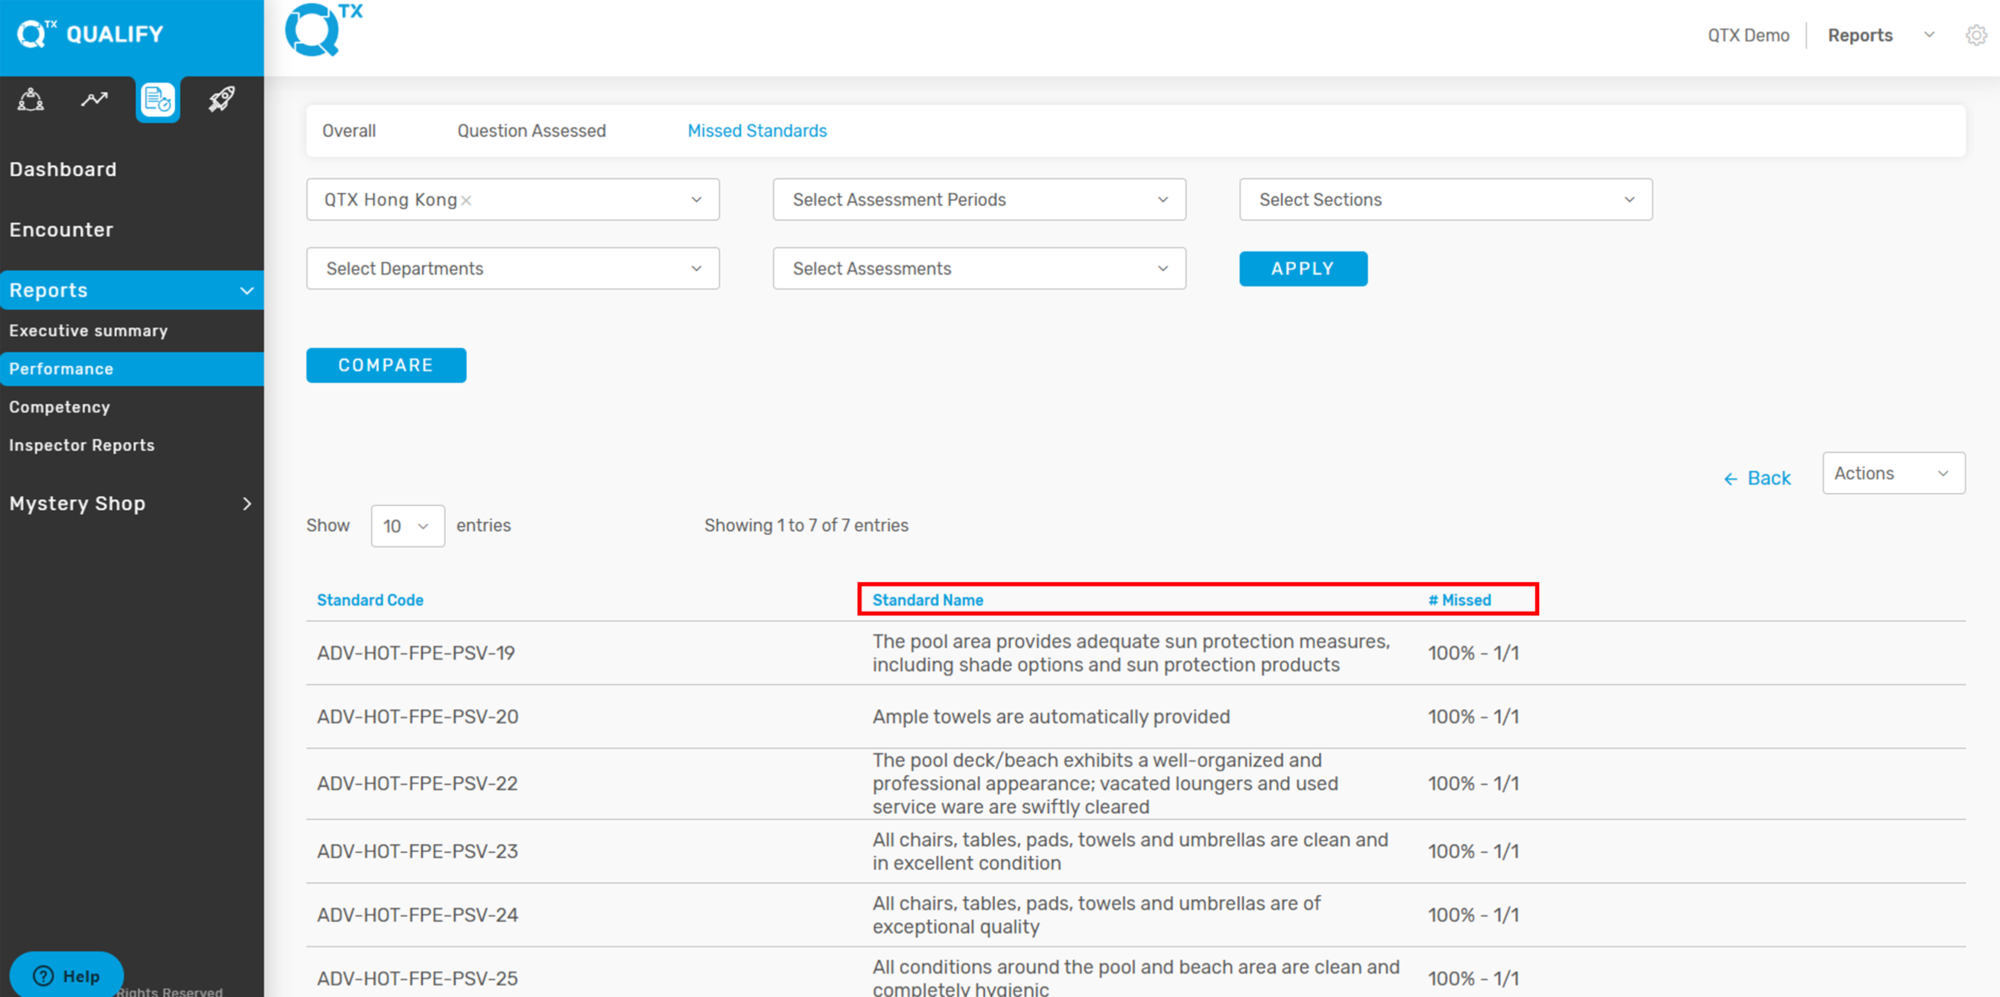
3. Click the “Missed Standards” tab to access the relevant section. Then, use the selection list to filter and choose the specific information you want to view. And click the “Apply” button.


4. The report will display the total of missed standards by number and percentage, based on the selected Assessment Name.


5. Click on any Assessment Name, and the list of missed standards per standard will be displayed as shown below.


If you need further assistance, please send an email to helpdesk@q-tx.com
Qualify: How to View Summary of Questions Assessed

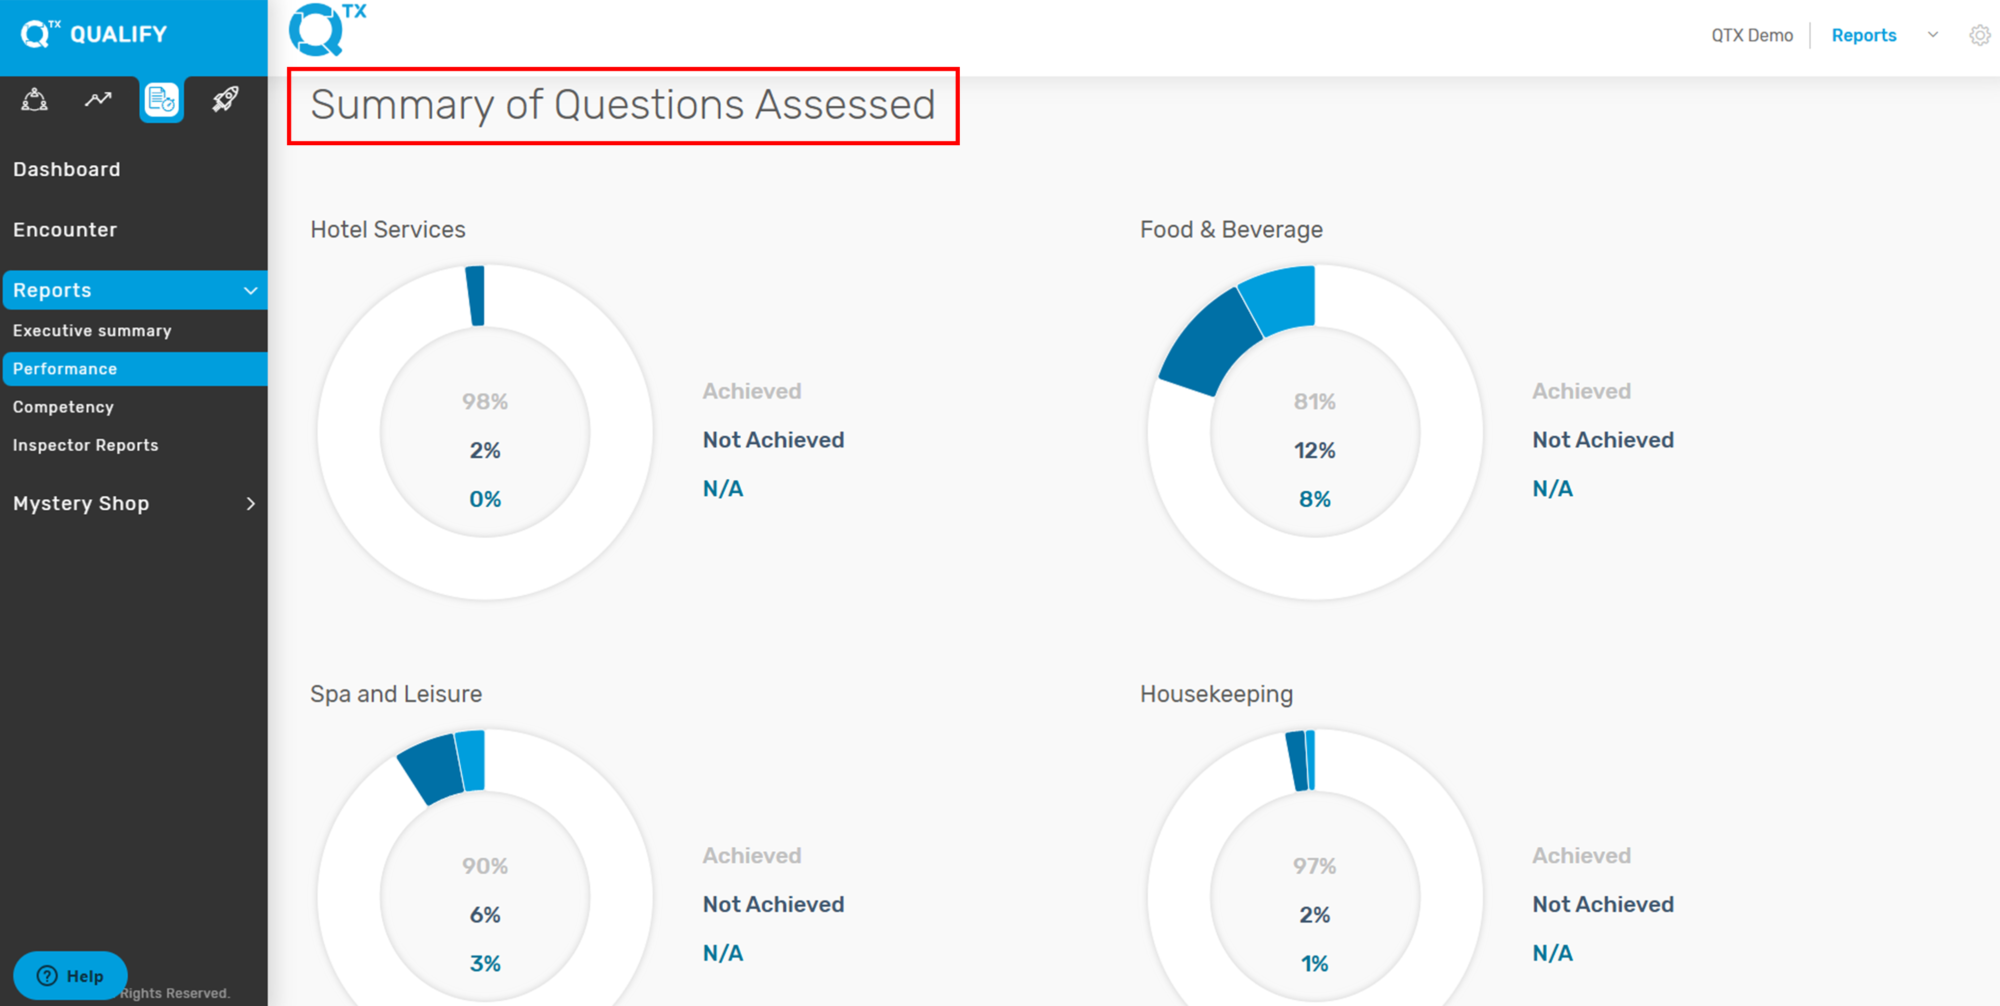
This displays a summary of the questions that have been achieved and not achieved by the department. The percentage score is presented in both pie chart and table formats.


1. On the Dashboard landing page, click the “QUALIFY” button to proceed.


2. Click on the “Reports” button, then select “Performance”.


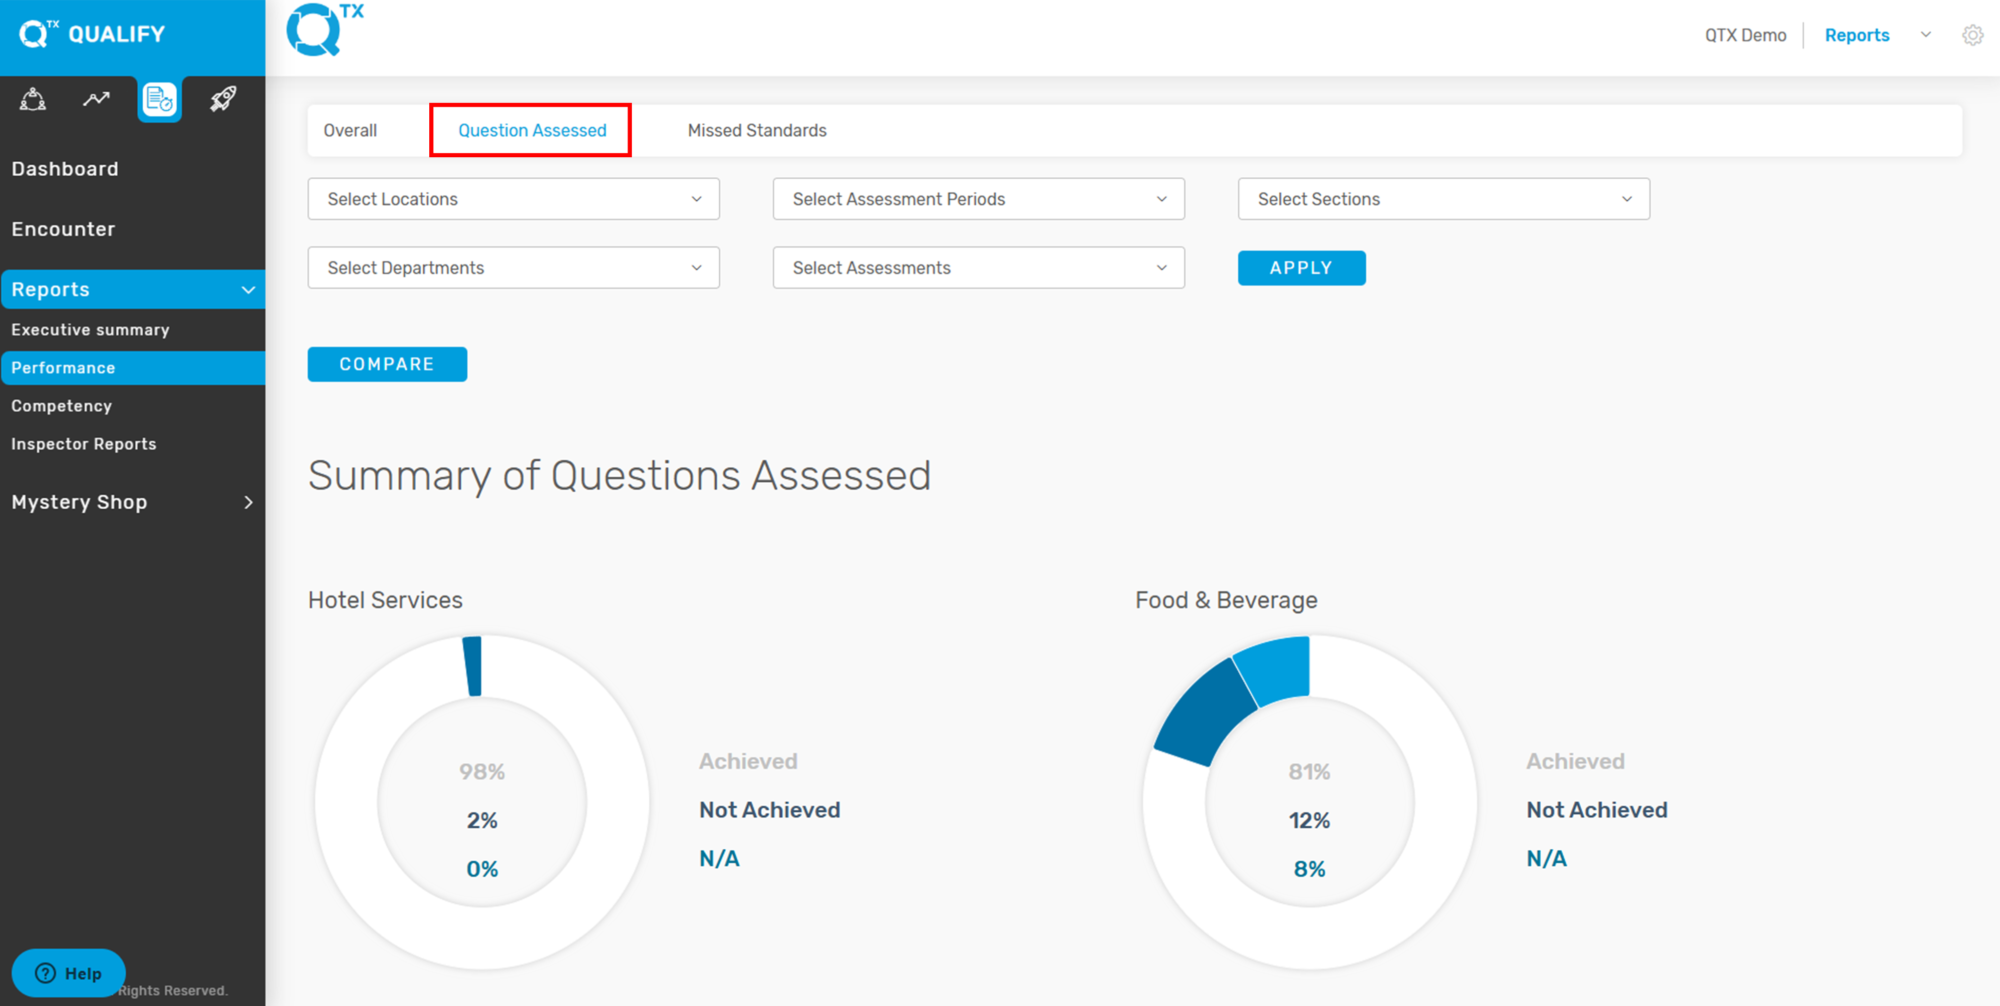
3. Click the “Question Assessed” Tab. Then, use the selection list to filter and choose the specific information you want to view.


4. The system will display a summary of the assessed questions as a percentage, shown in a pie chart.


5. This table helps provide a clear overview of how each department performed in its assessments. By showing the percentage of Achieved, Not Achieved, and N/A responses, it allows users to quickly identify strengths and areas for improvement.

The N/A (Not Applicable) score is important because it indicates questions that were not relevant to the specific department or situation. These are excluded from the final performance calculation to ensure the score accurately reflects only the applicable criteria. This prevents departments from being unfairly scored on items outside their scope of responsibility.


If you need further assistance, please send an email to helpdesk@q-tx.com

Qualify: How to View the Overall Performance Report

The Performance Report enables management to provide positive feedback and identify areas for improvement. It also allows departments to review results collaboratively and develop action plans to enhance skills and performance.


1. On the Dashboard landing page, click the “QUALIFY” button to proceed.


2. Click on the “Reports” button, then select “Performance”.


3. The system will redirect you to the ‘Overall’ tab. From there, select the relevant information from the dropdown list to apply filters.


4. The Overall Performance score is displayed as a percentage and shown in a graph format. Hover your cursor over a bar in the graph to view the exact Overall score.


If you need further assistance, please send an email to helpdesk@q-tx.com