Where Can I Upload a QR Code Assessment?

Answer

QR Code assessments can be uploaded through the Manage Assessment section under Assessment Builder.

Steps to Upload a QR Code Assessment

Log in to your QTX account.

Navigate to Manage Assessment from the main menu.

Click Assessment Builder.

Upload or generate the QR Code for the selected assessment.

Once generated, you can share the QR Code for easy access to the assessment without requiring users to log in to QTX.

How to View Details from Attachment Image Popup as a Inspector Role

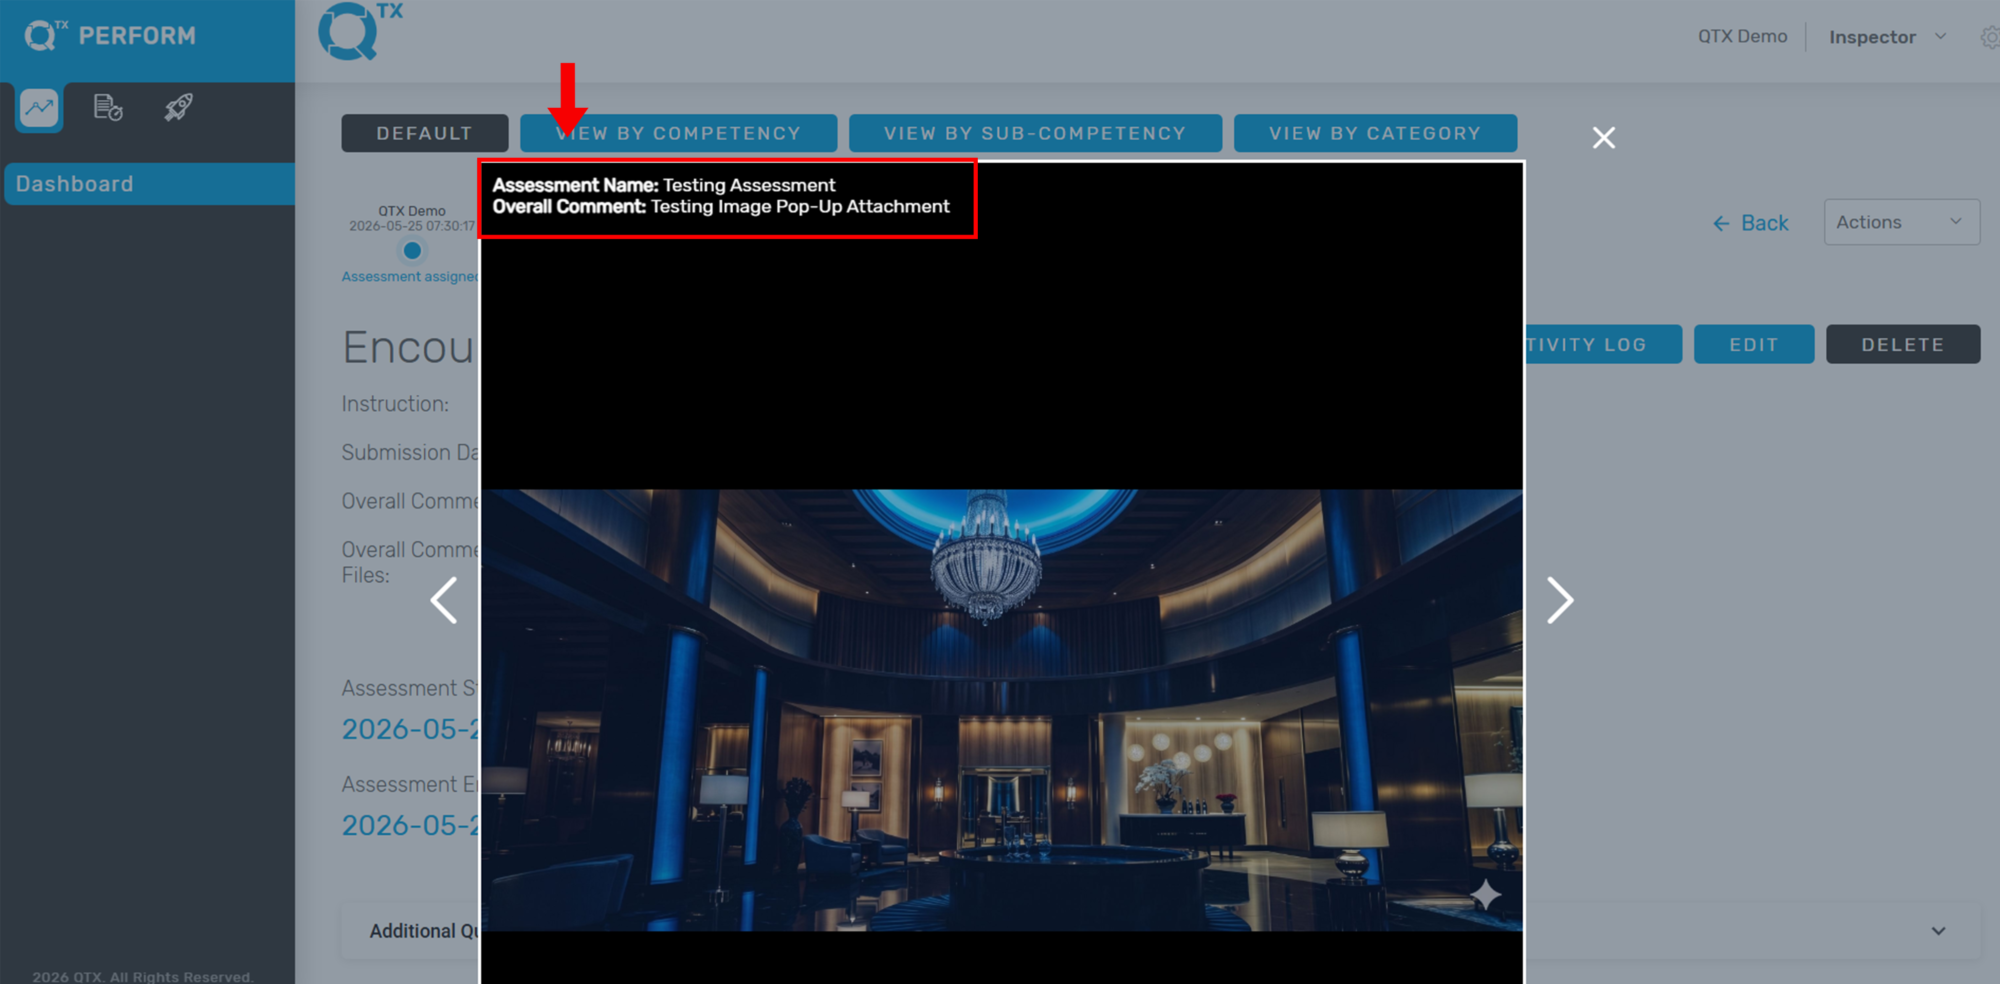
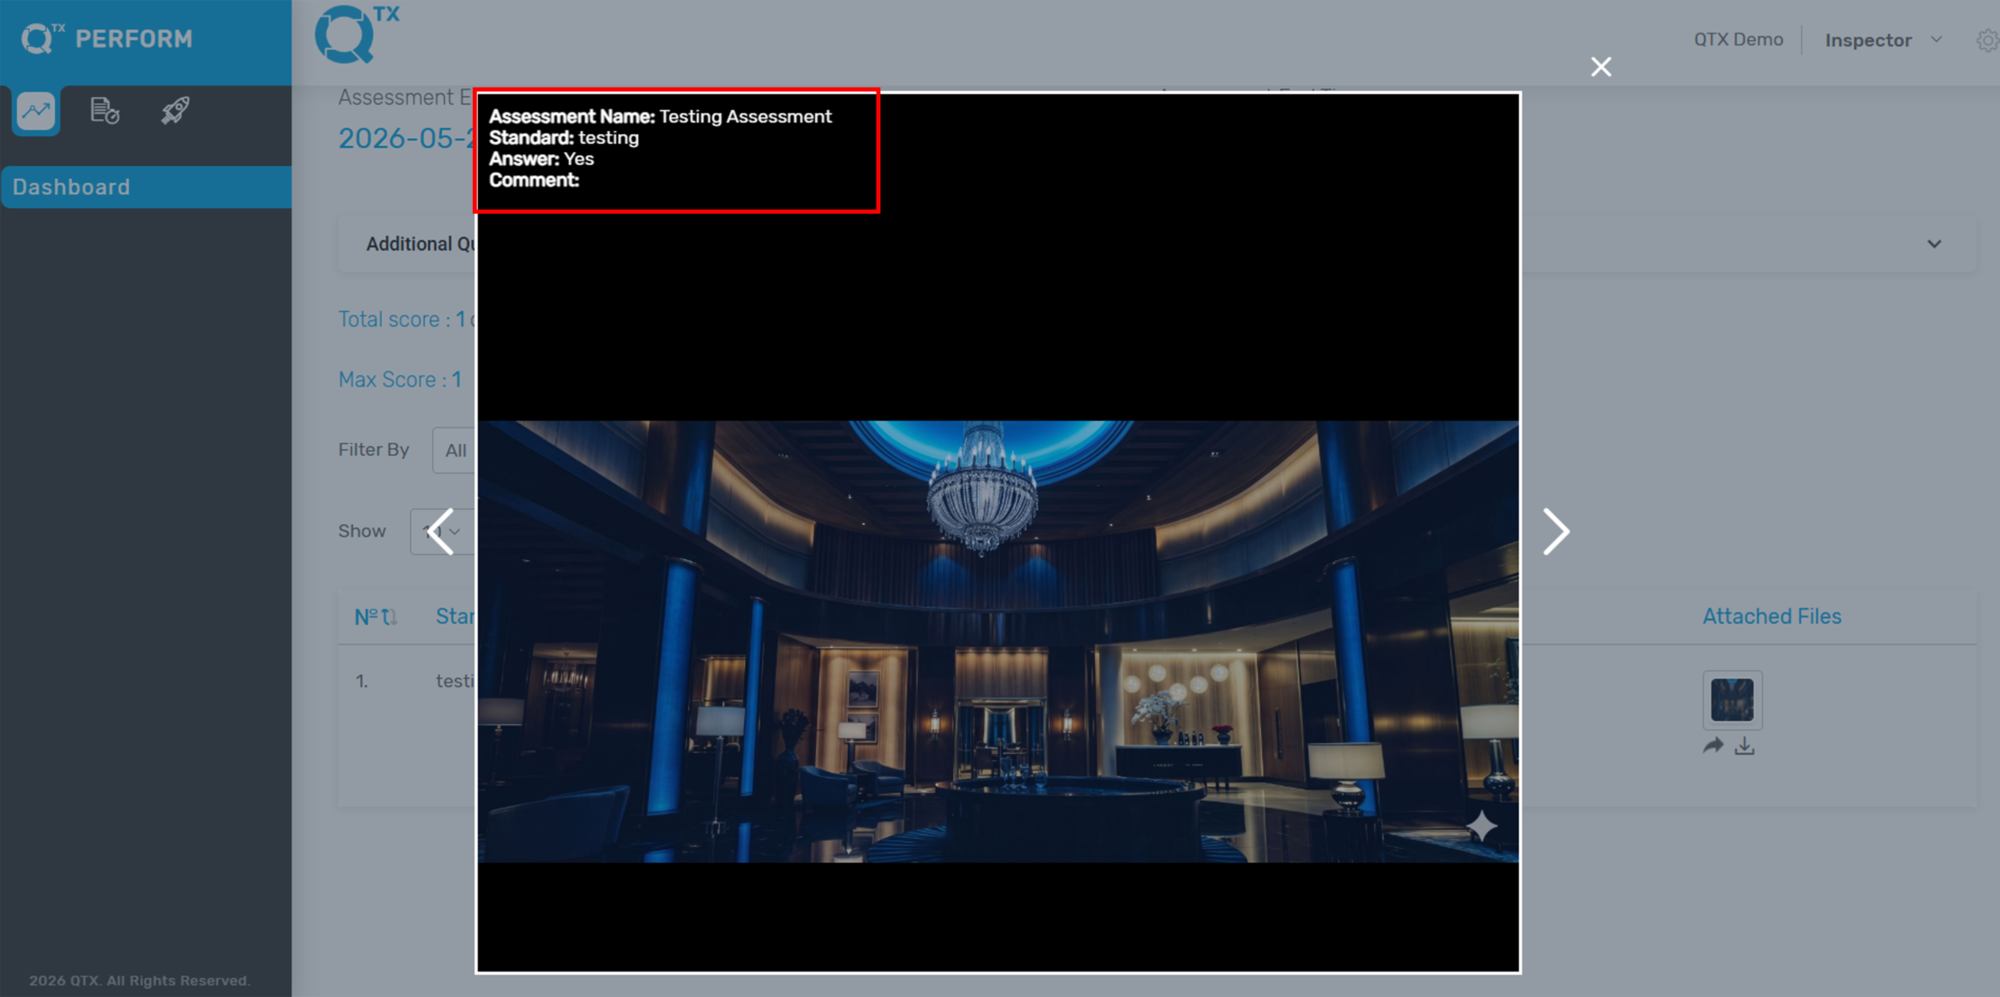
The Attachment Image Popup feature allows Inspector Role users to quickly view detailed information related to uploaded image attachments within the Encounter Report. Clicking an image attachment opens a pop-up displaying the associated assessment details and comments.


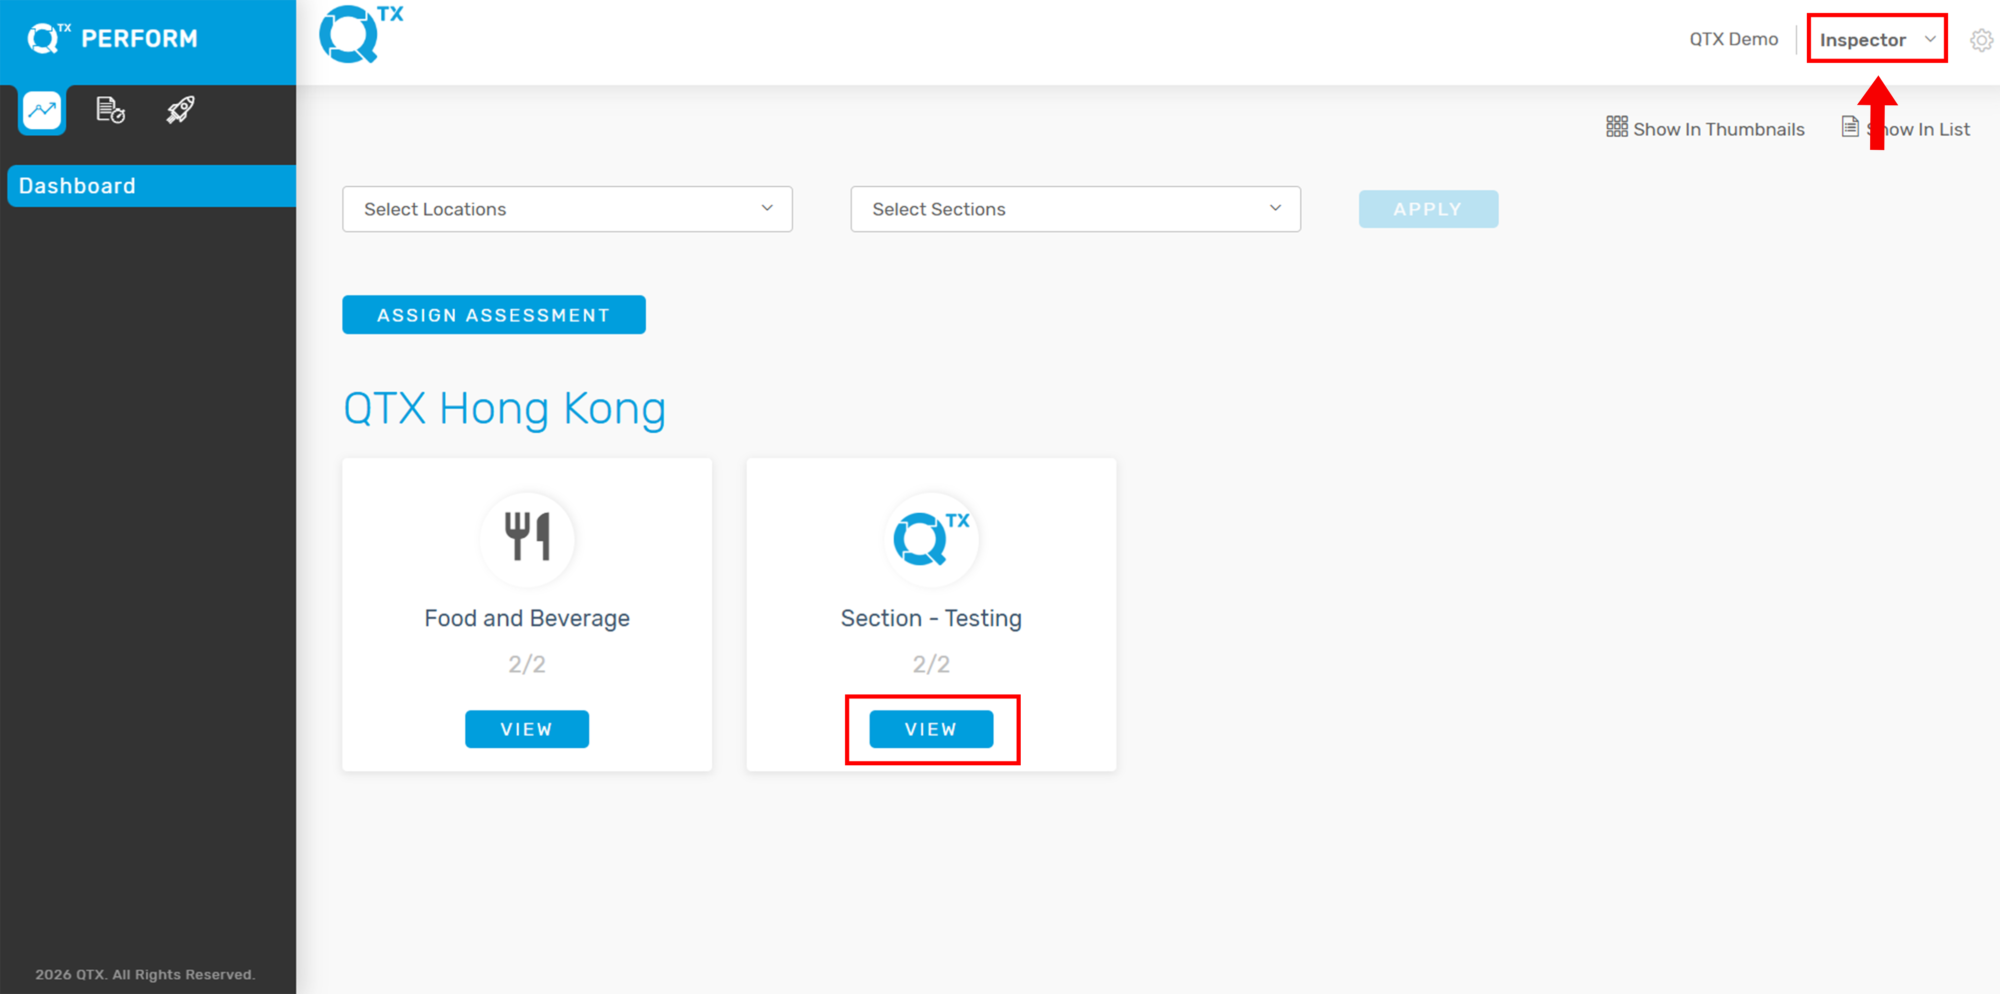
1. Log in to your QTX account using your Inspector Role credentials. On the dashboard, you will see all assessments assigned to you. Click View on the selected assessment section.


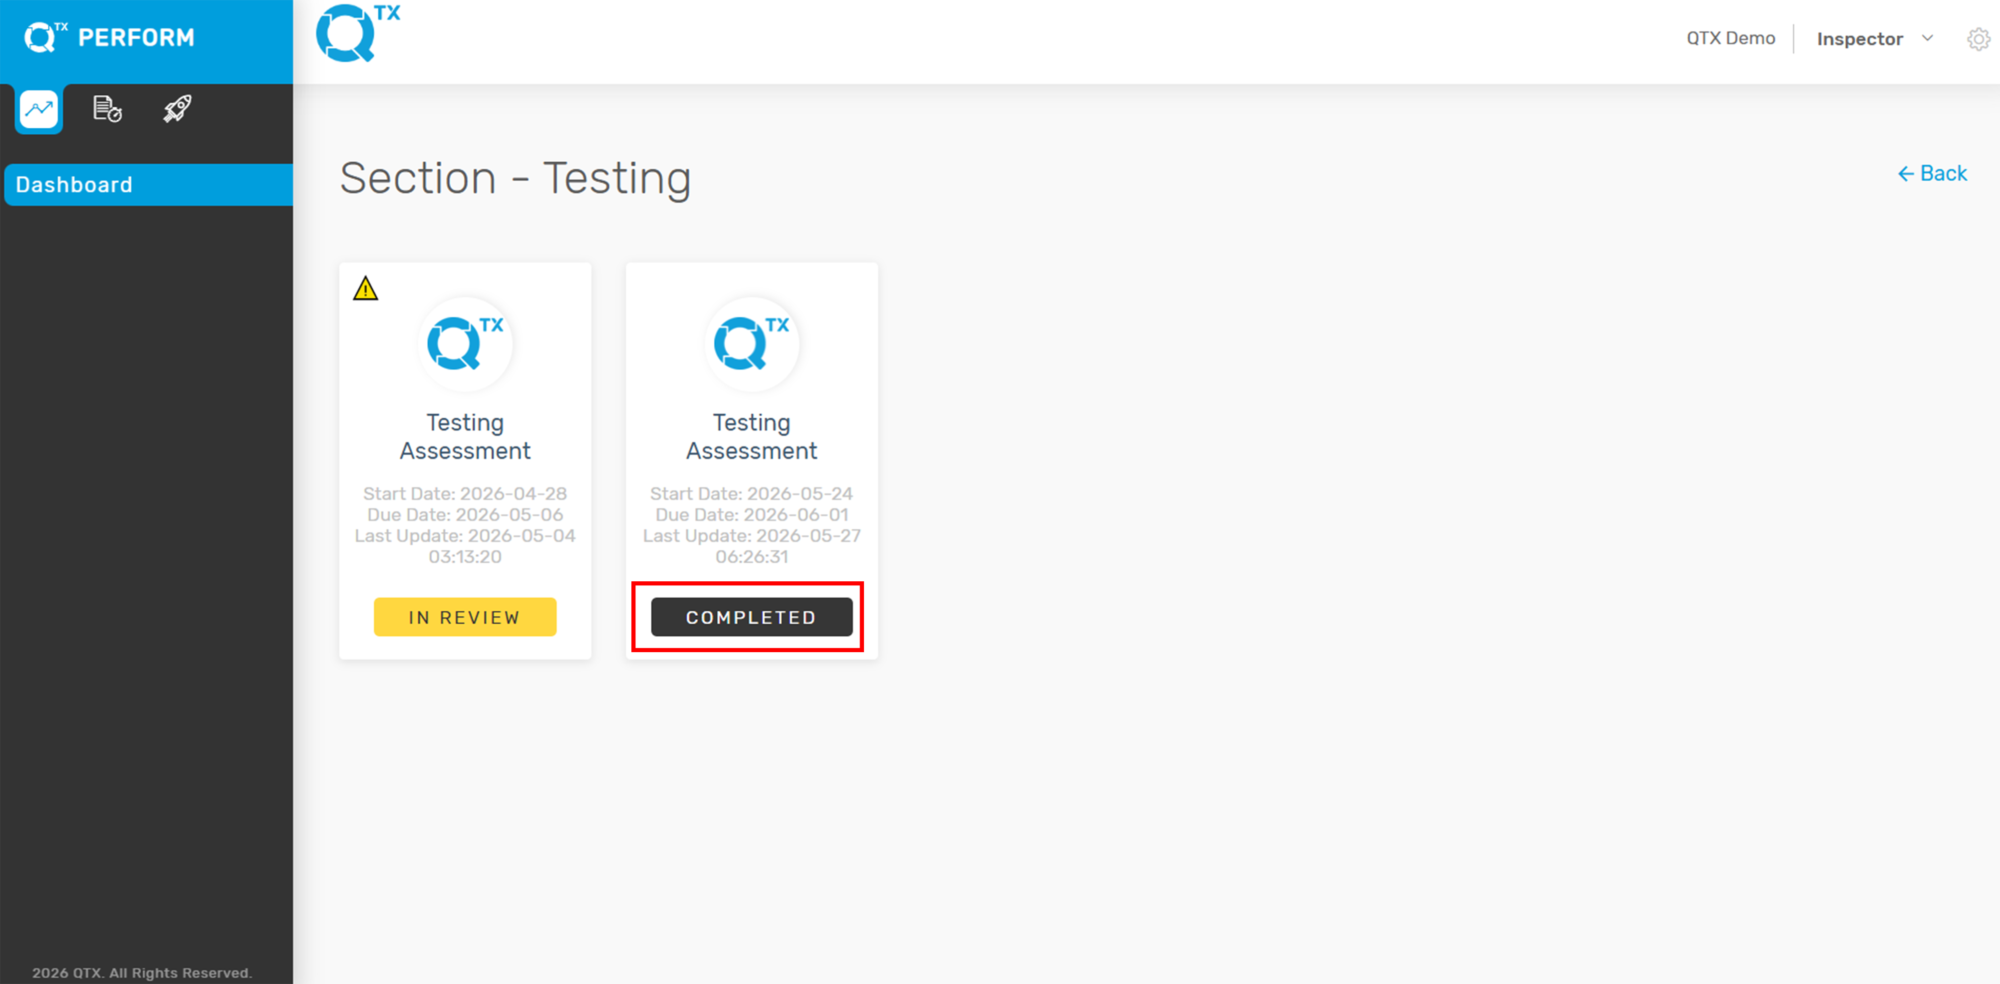
2. Click the assessment to open and view the uploaded images and encounter details.


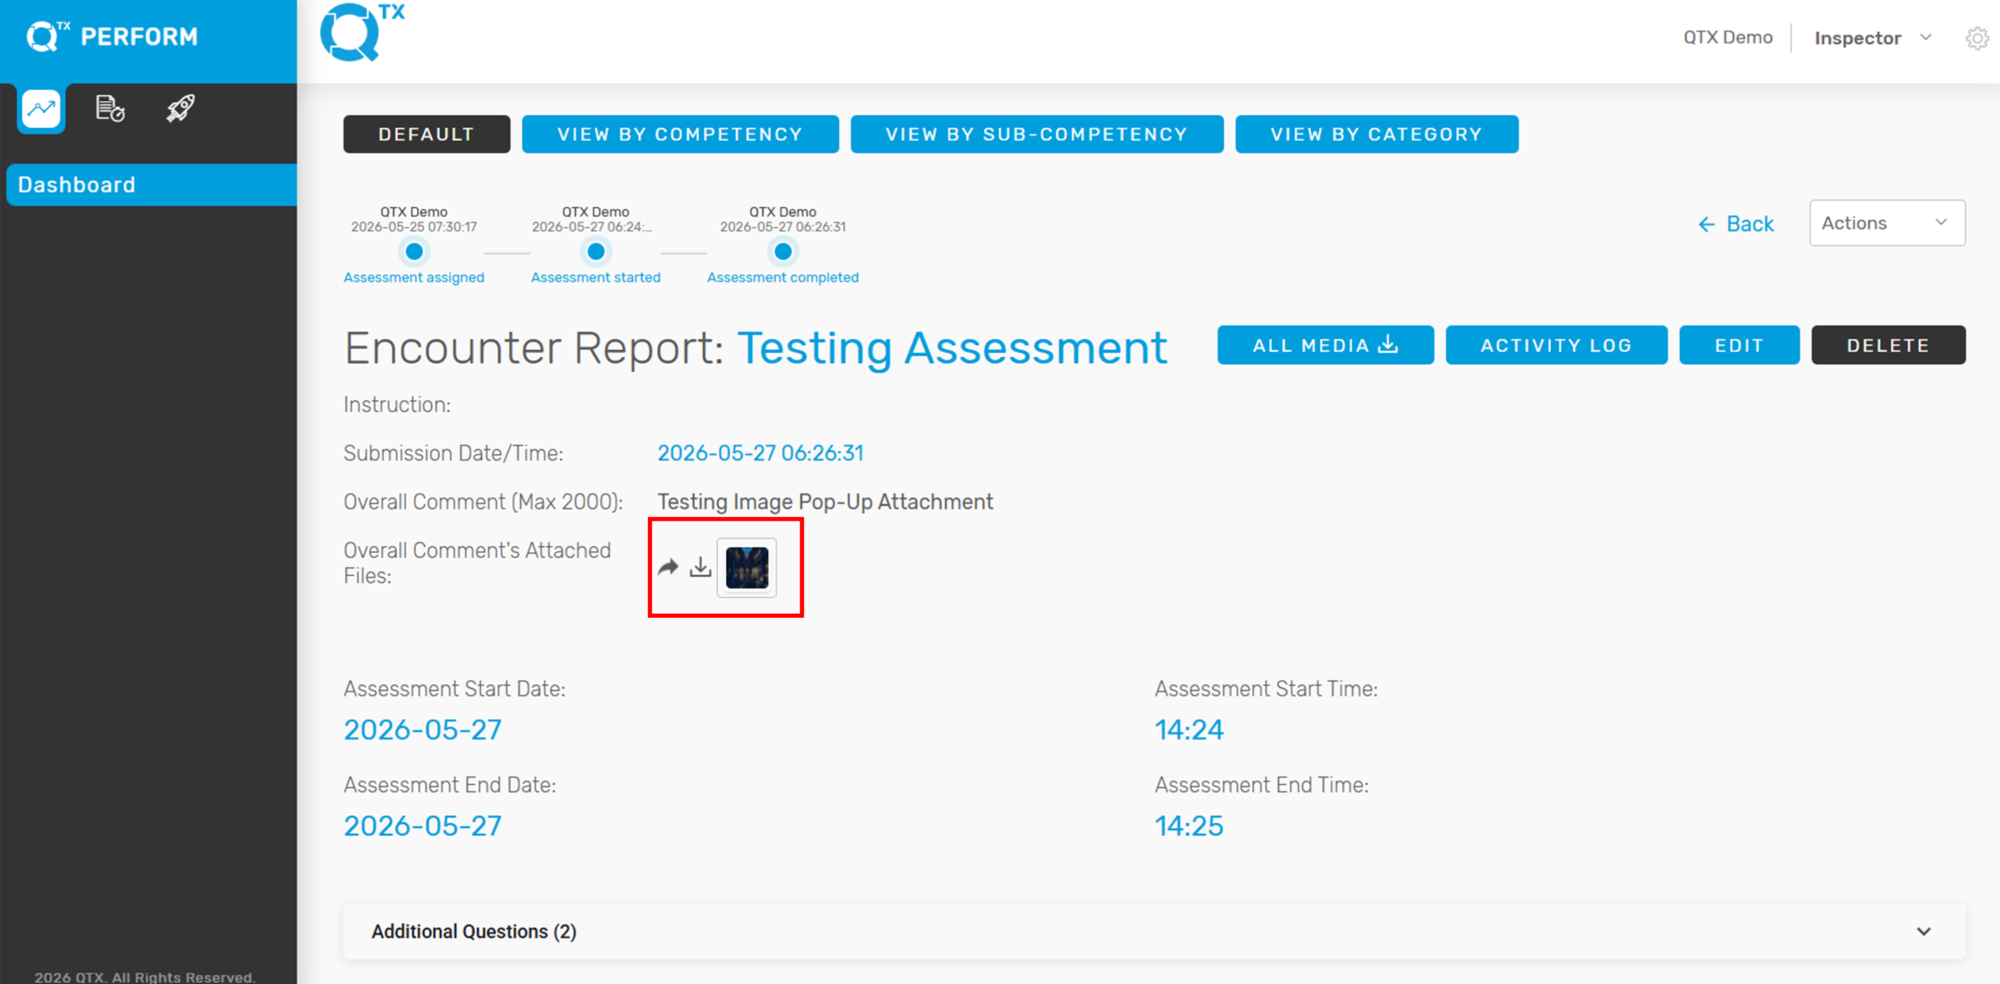
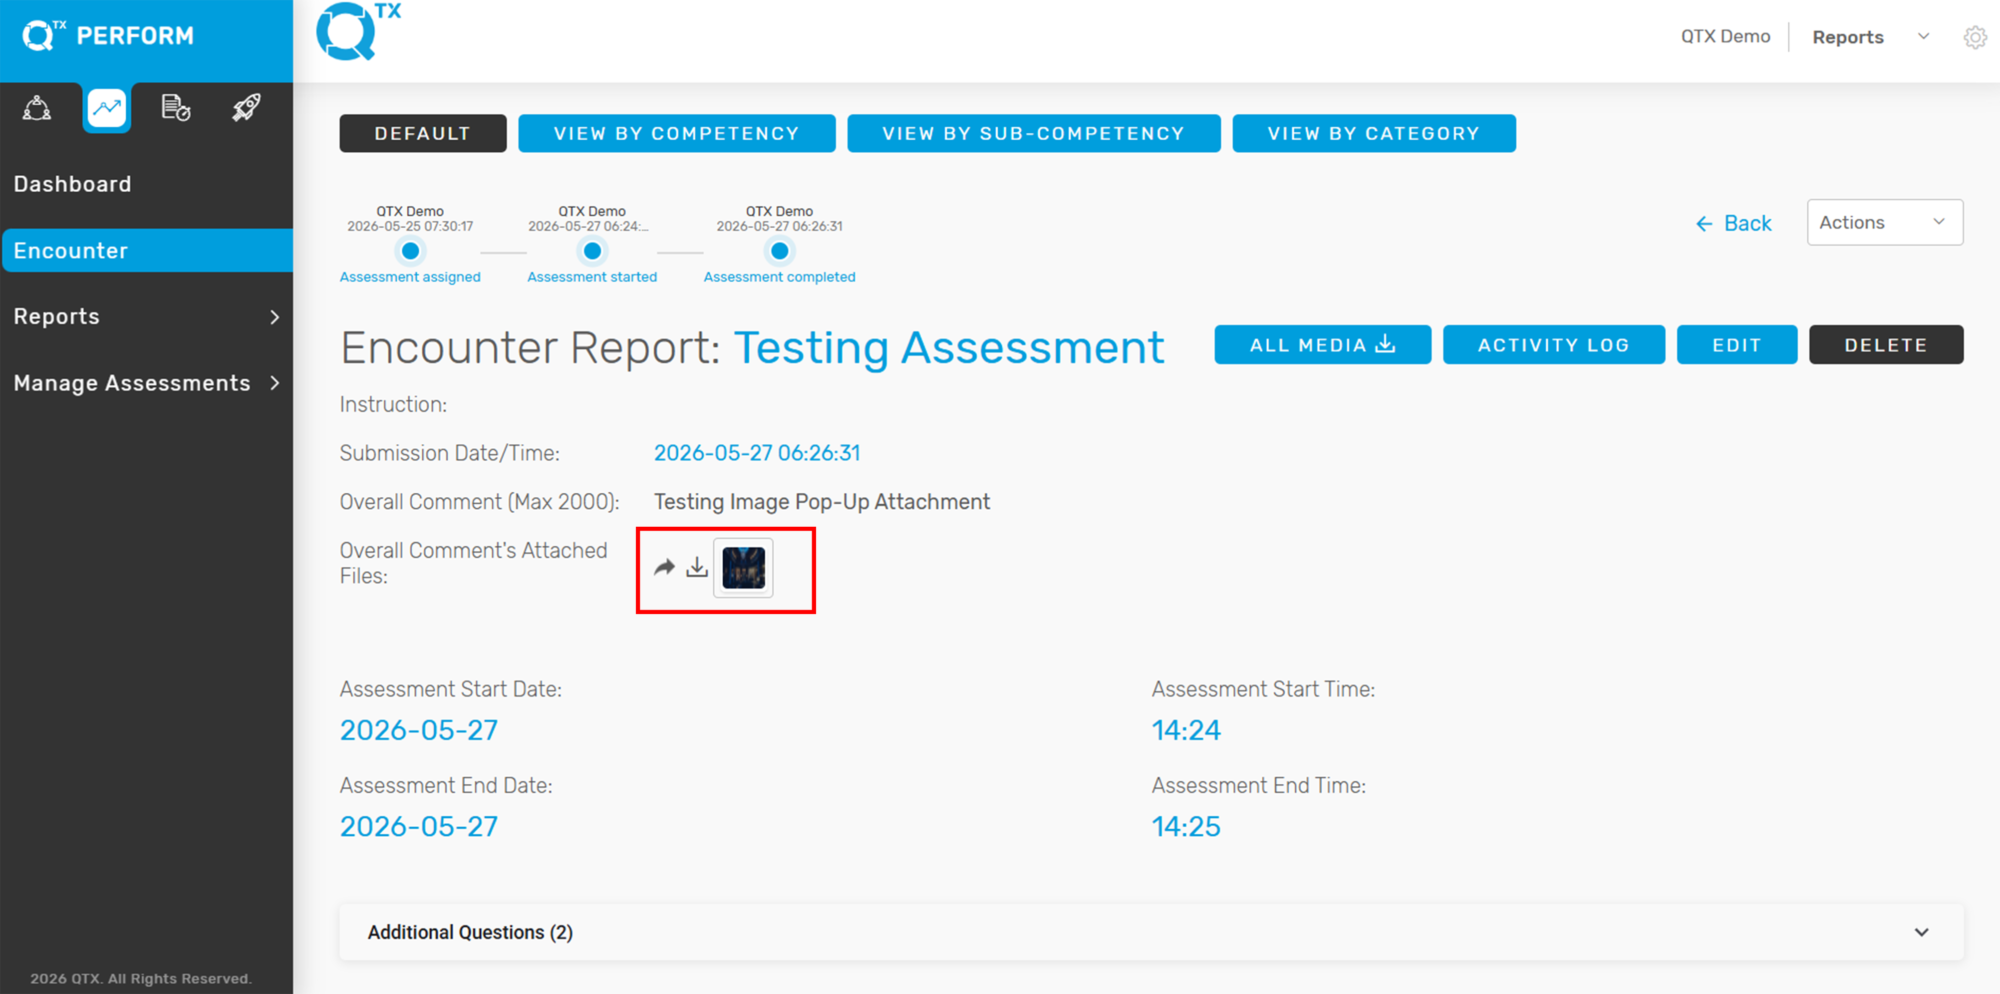
3. In the Encounter Report, locate the image attachment under the Overall Comment section and click the image.


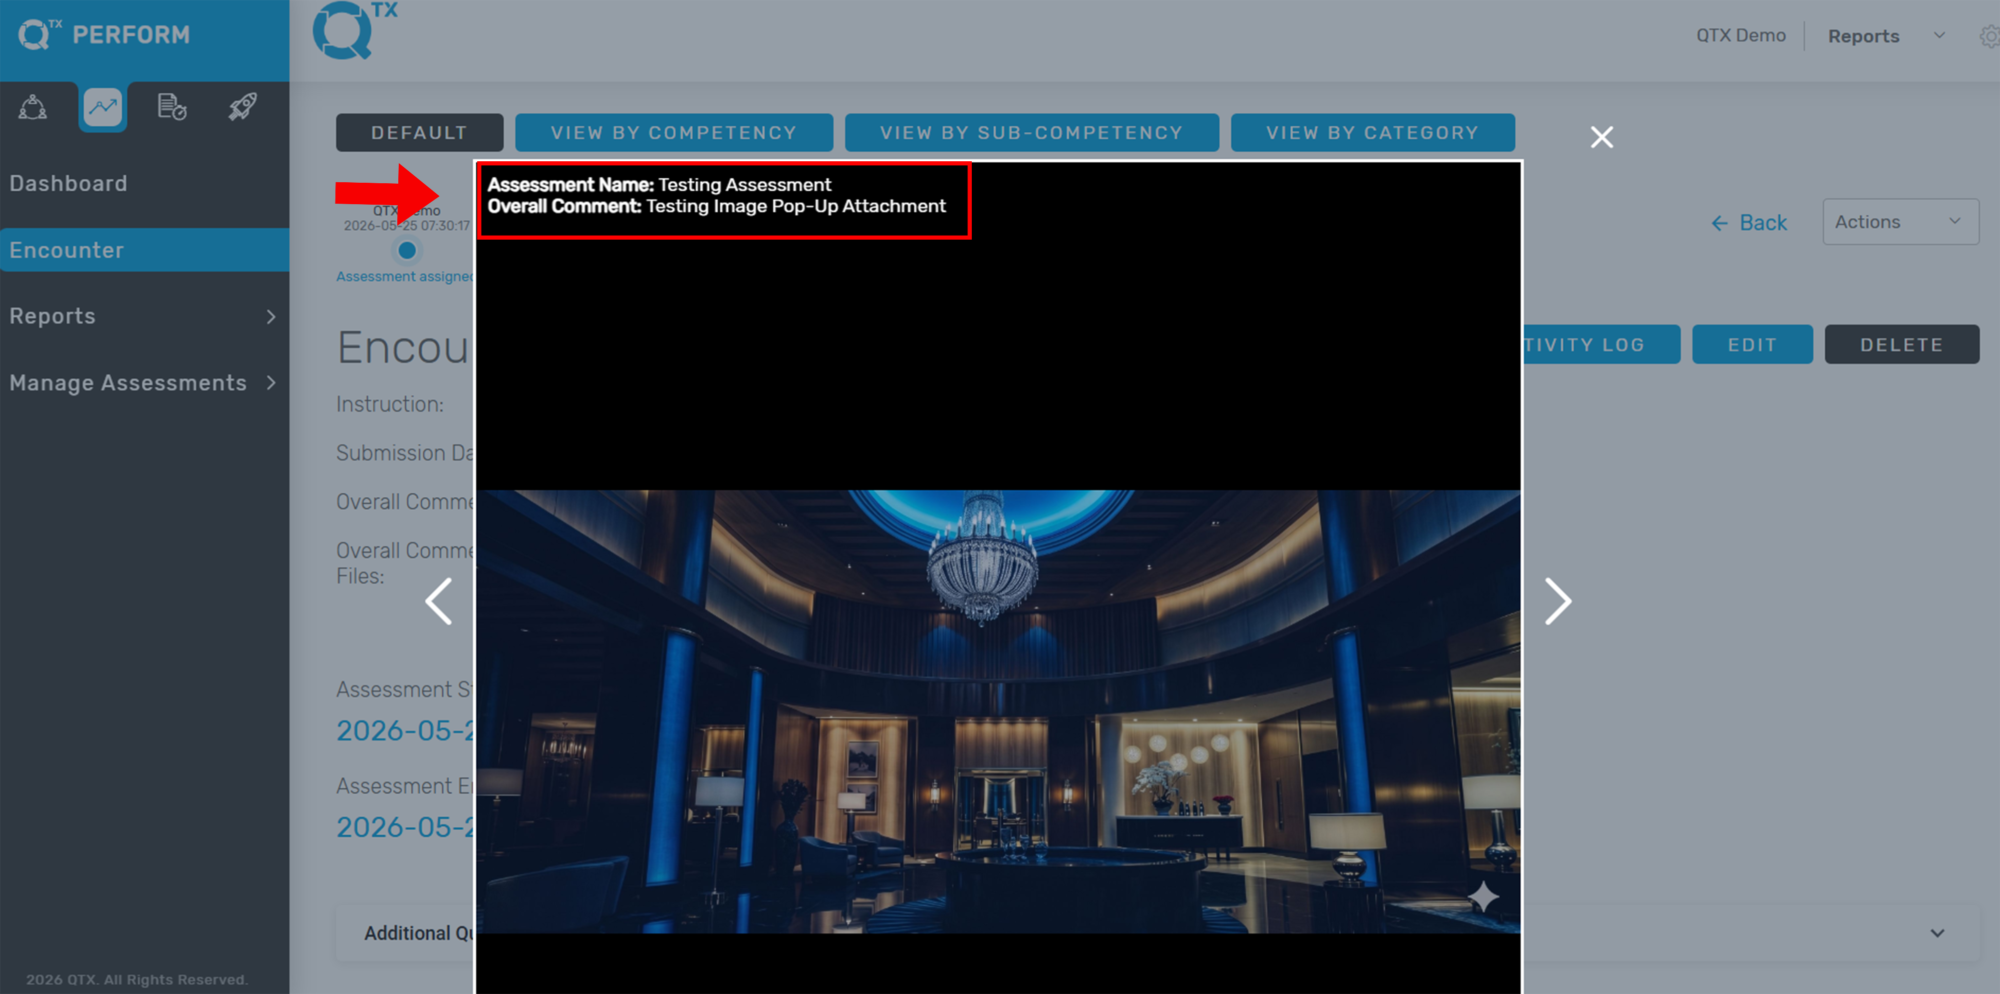
4. A pop-up window will appear displaying the following details:
– Assessment Name
– Overall Comment
This feature allows users to review attachment-related information quickly without leaving the Encounter Report page.


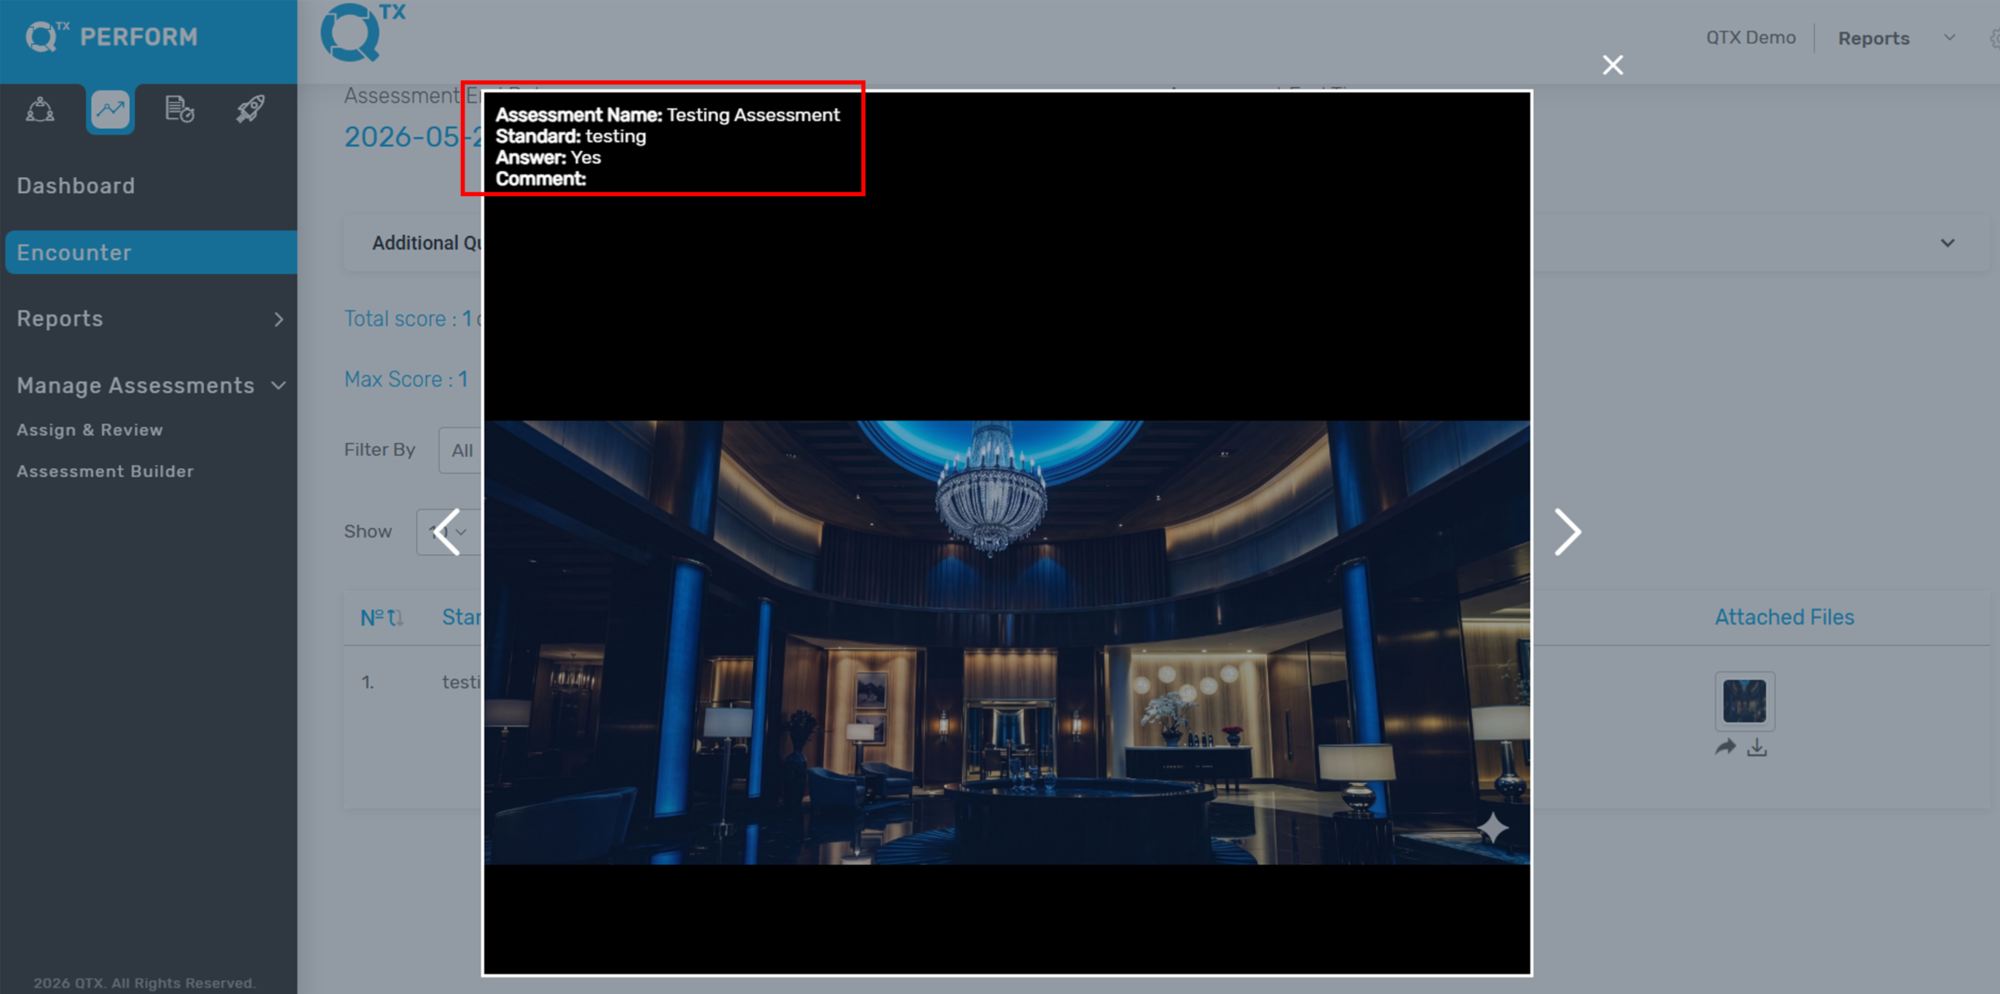
Same if you click the image attachment associated with the standard. The pop-up window will display the following information:
– Assessment Name
– Standard
– Answer
– Comment


If you need further assistance, please send an email to helpdesk@q-tx.com

How to View Details from Attachment Image Popup as a Reporting Role

The Attachment Image Popup feature allows Reporting Role users to quickly view detailed information related to image attachments within the Encounter Report. Clicking an image attachment opens a pop-up displaying the associated assessment details and comments.


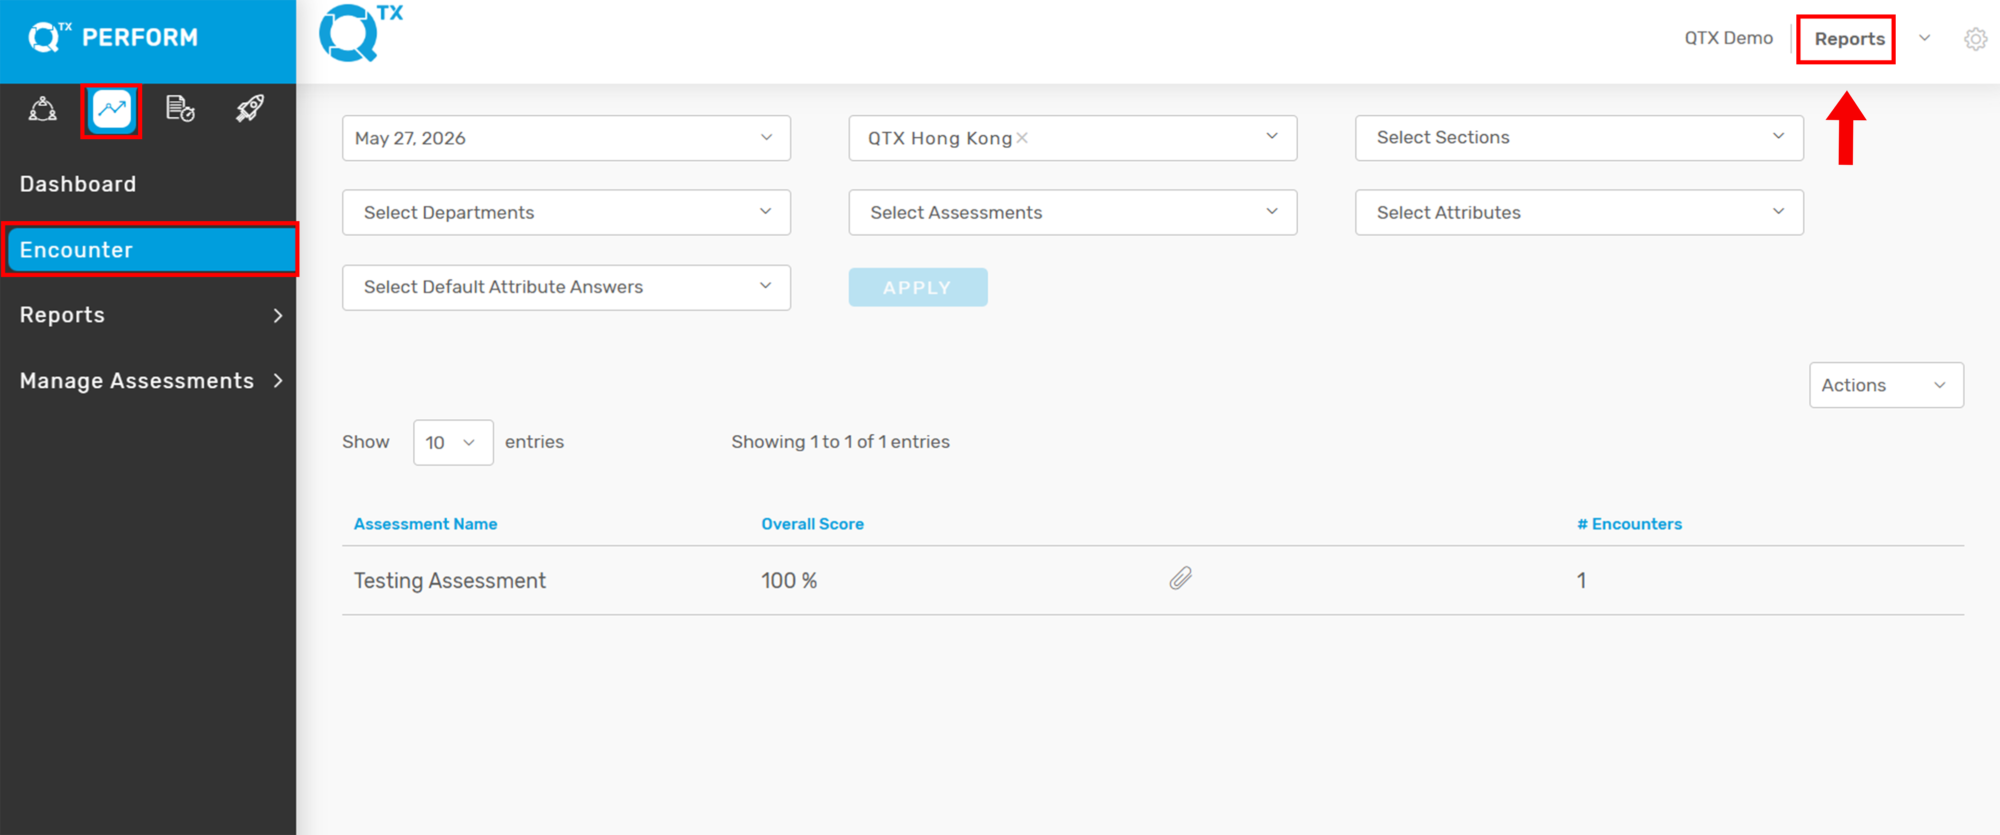
1. Log in to your QTX account using your Reporting Role credentials, then navigate to the Encounter Report page from the main menu.


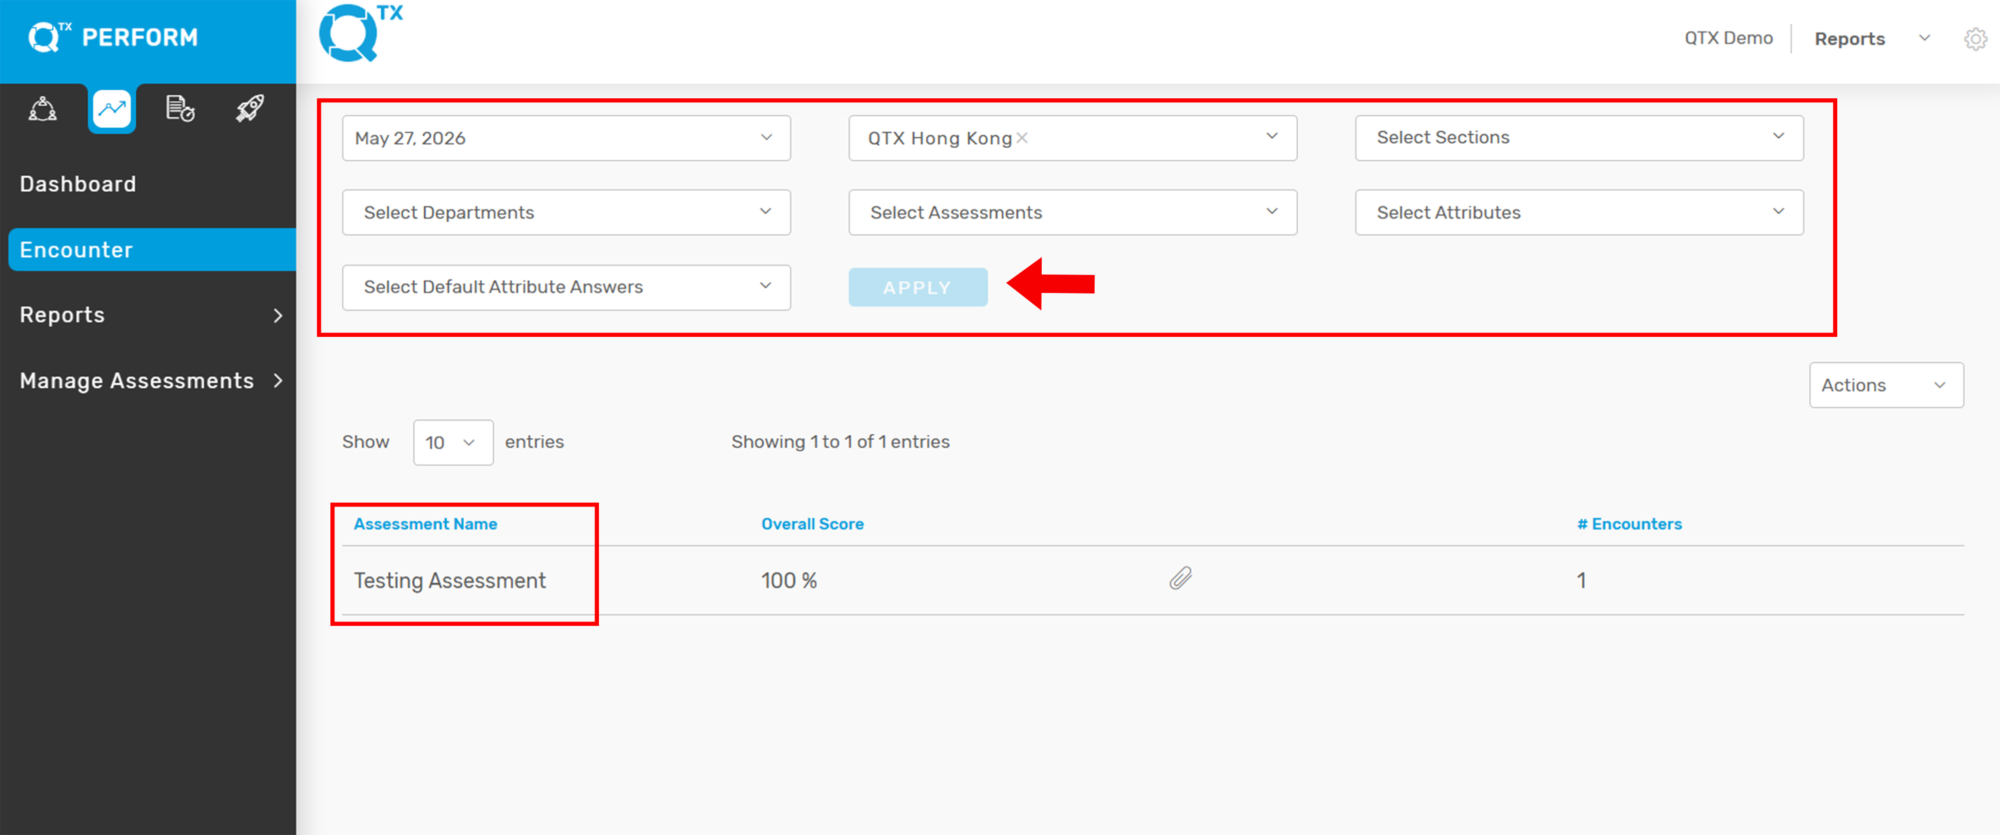
2. Use the filters to select the specific Location, Section, and Department. Click the Assessment Name displayed.


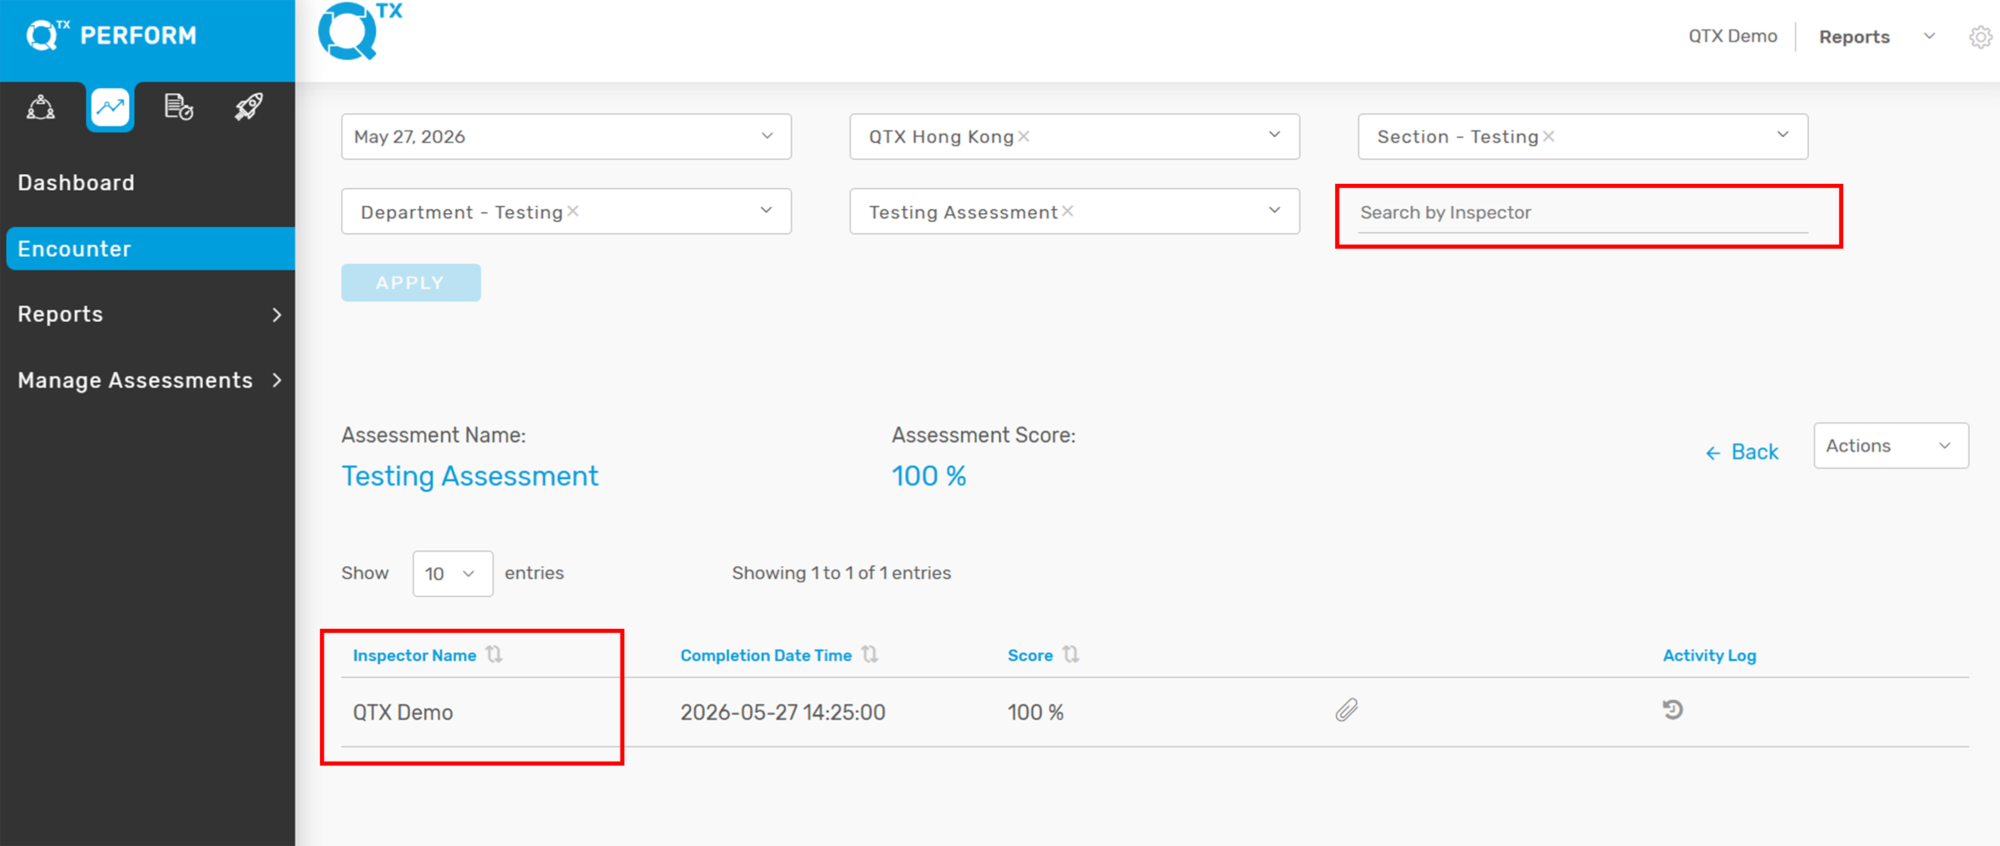
3. Locate the specific inspector by entering details in the Search by Inspector filter, then click the inspector’s name to open the Encounter Report.


4. In the Encounter Report, locate the image attachment under the Overall Comment section and click the image.


5 . A pop-up window will appear displaying the following details:
– Assessment Name
– Overall Comment
This feature allows users to review attachment-related information quickly without leaving the Encounter Report page.


Same if you click the image attachment associated with the standard. The pop-up window will display the following information:
– Assessment Name
– Standard
– Answer
– Comment


If you need further assistance, please send an email to helpdesk@q-tx.com

How to View Automatic Translation Comments to English

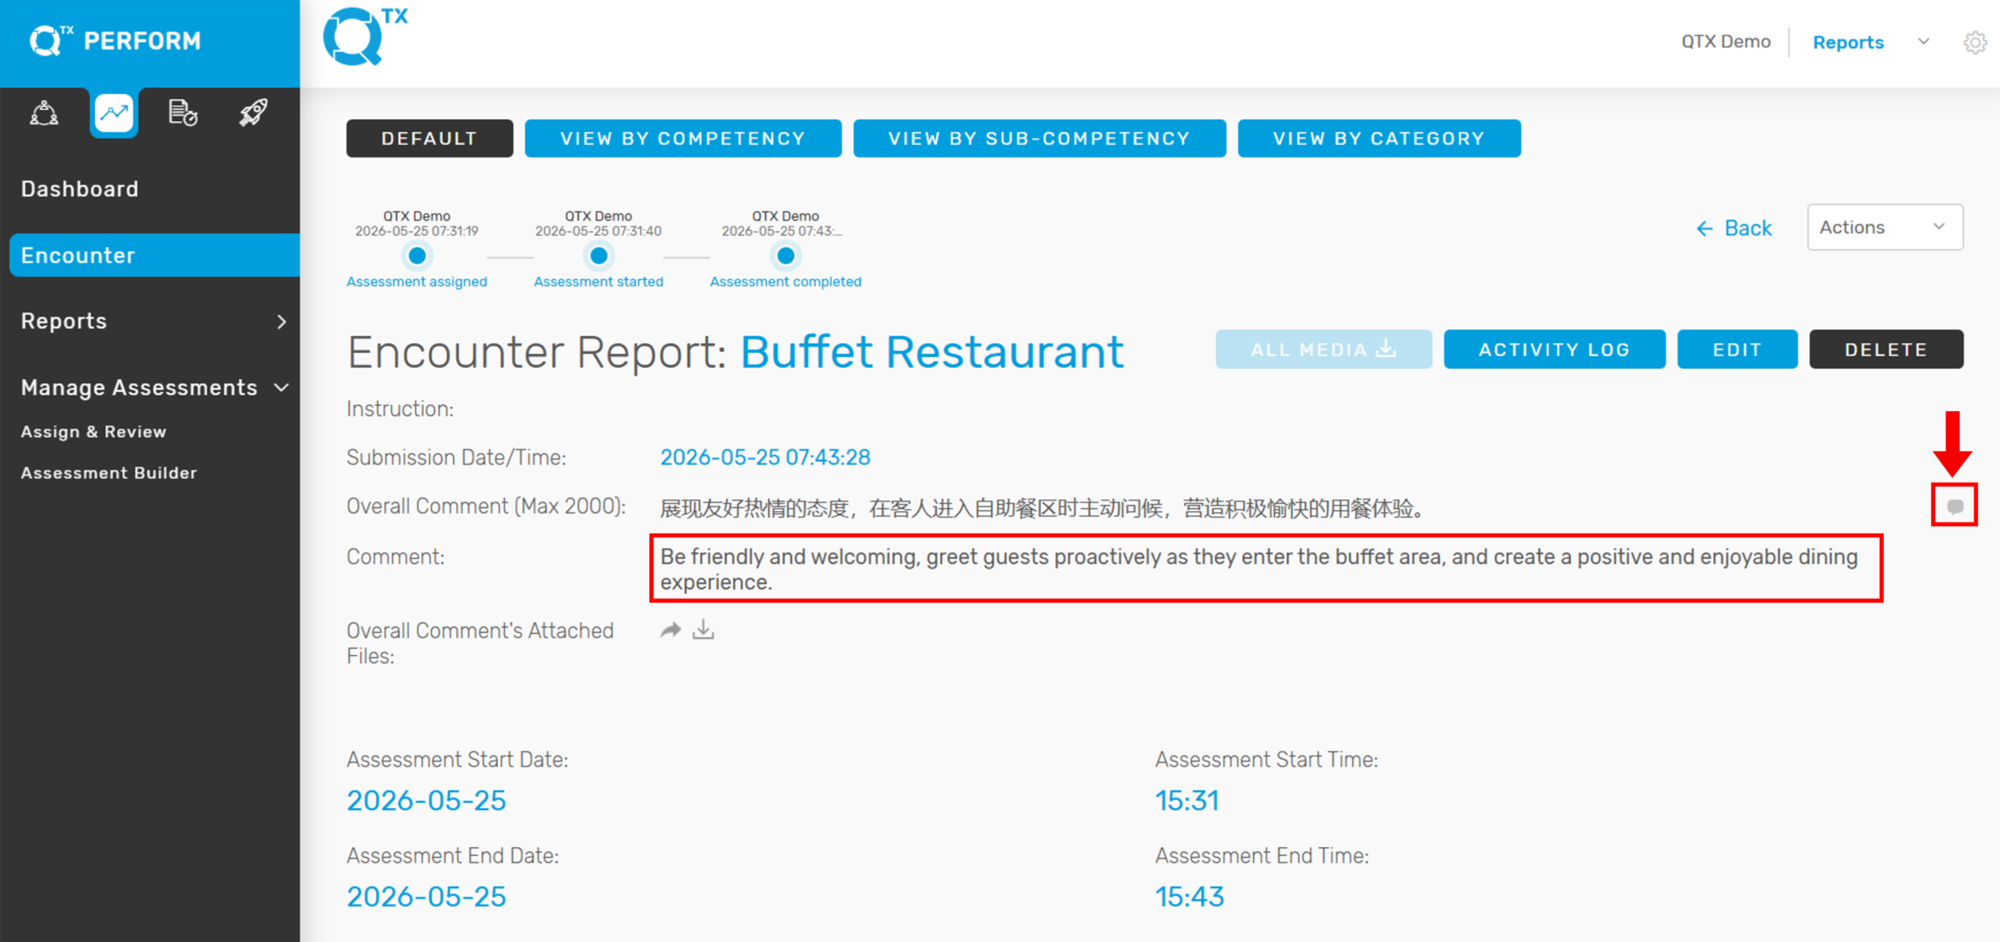
The translation feature allows users to view the English version of comments entered in different language characters. A translation icon is available within the Encounter Report and Standard Comment sections, providing quick and easy access to translated content.


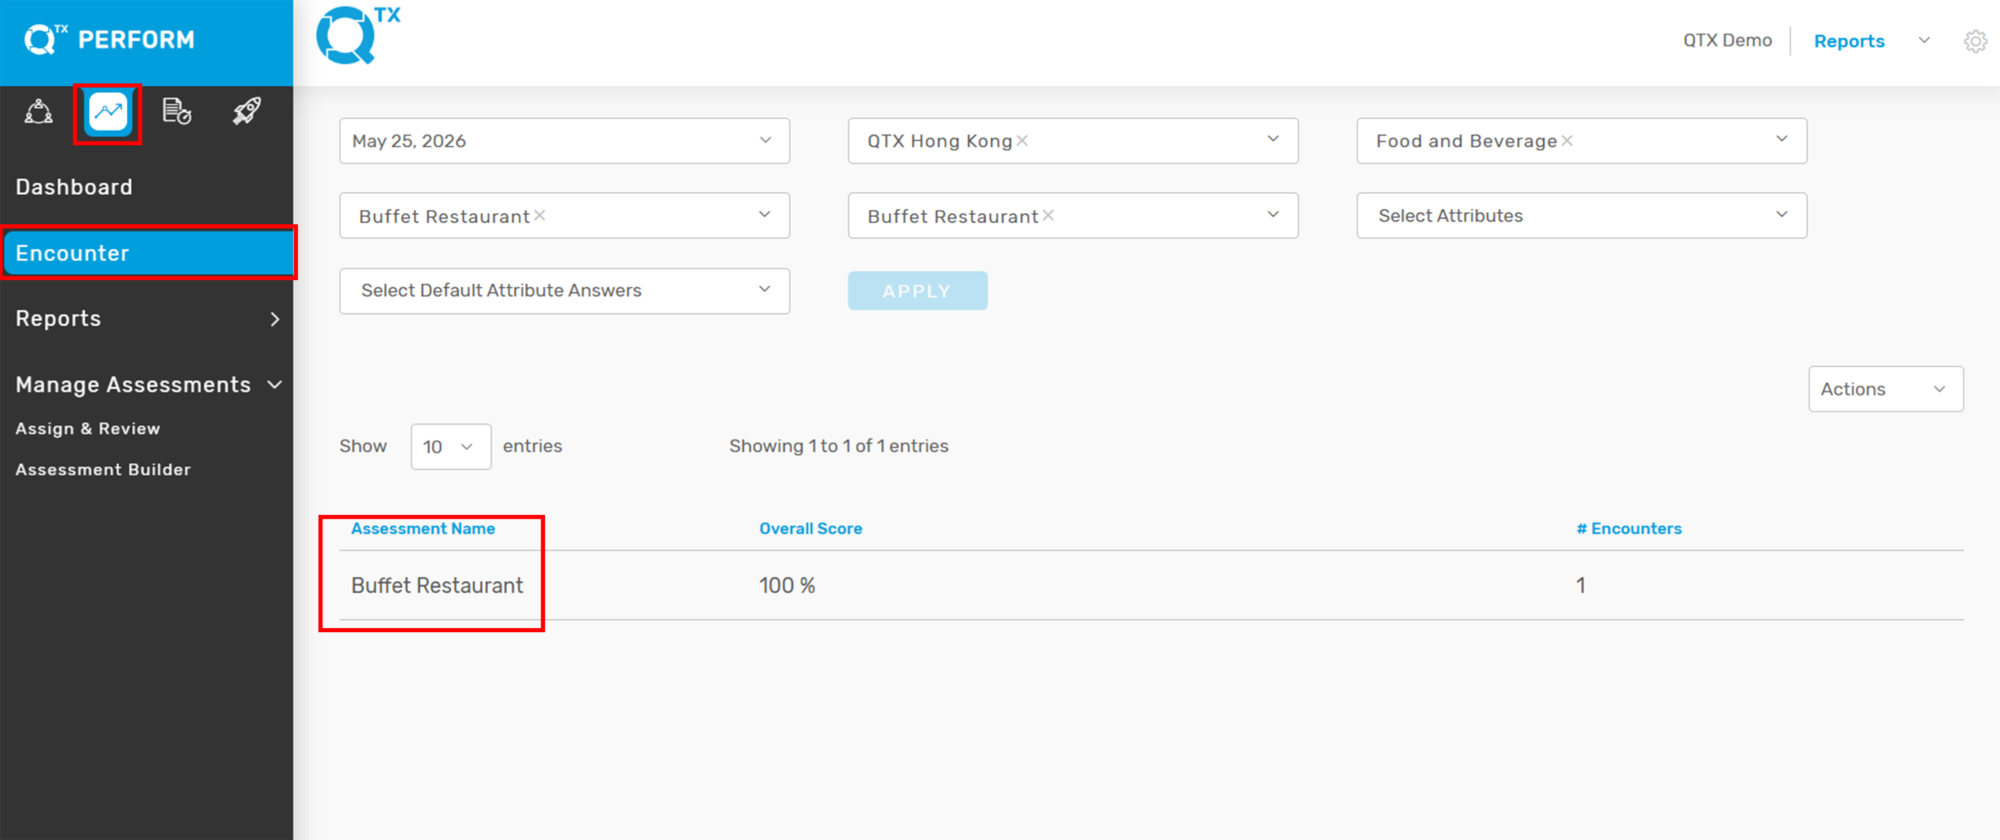
1. Log in to your QTX account. Navigate to the Encounter Report page. Click the assessment name you want to view.


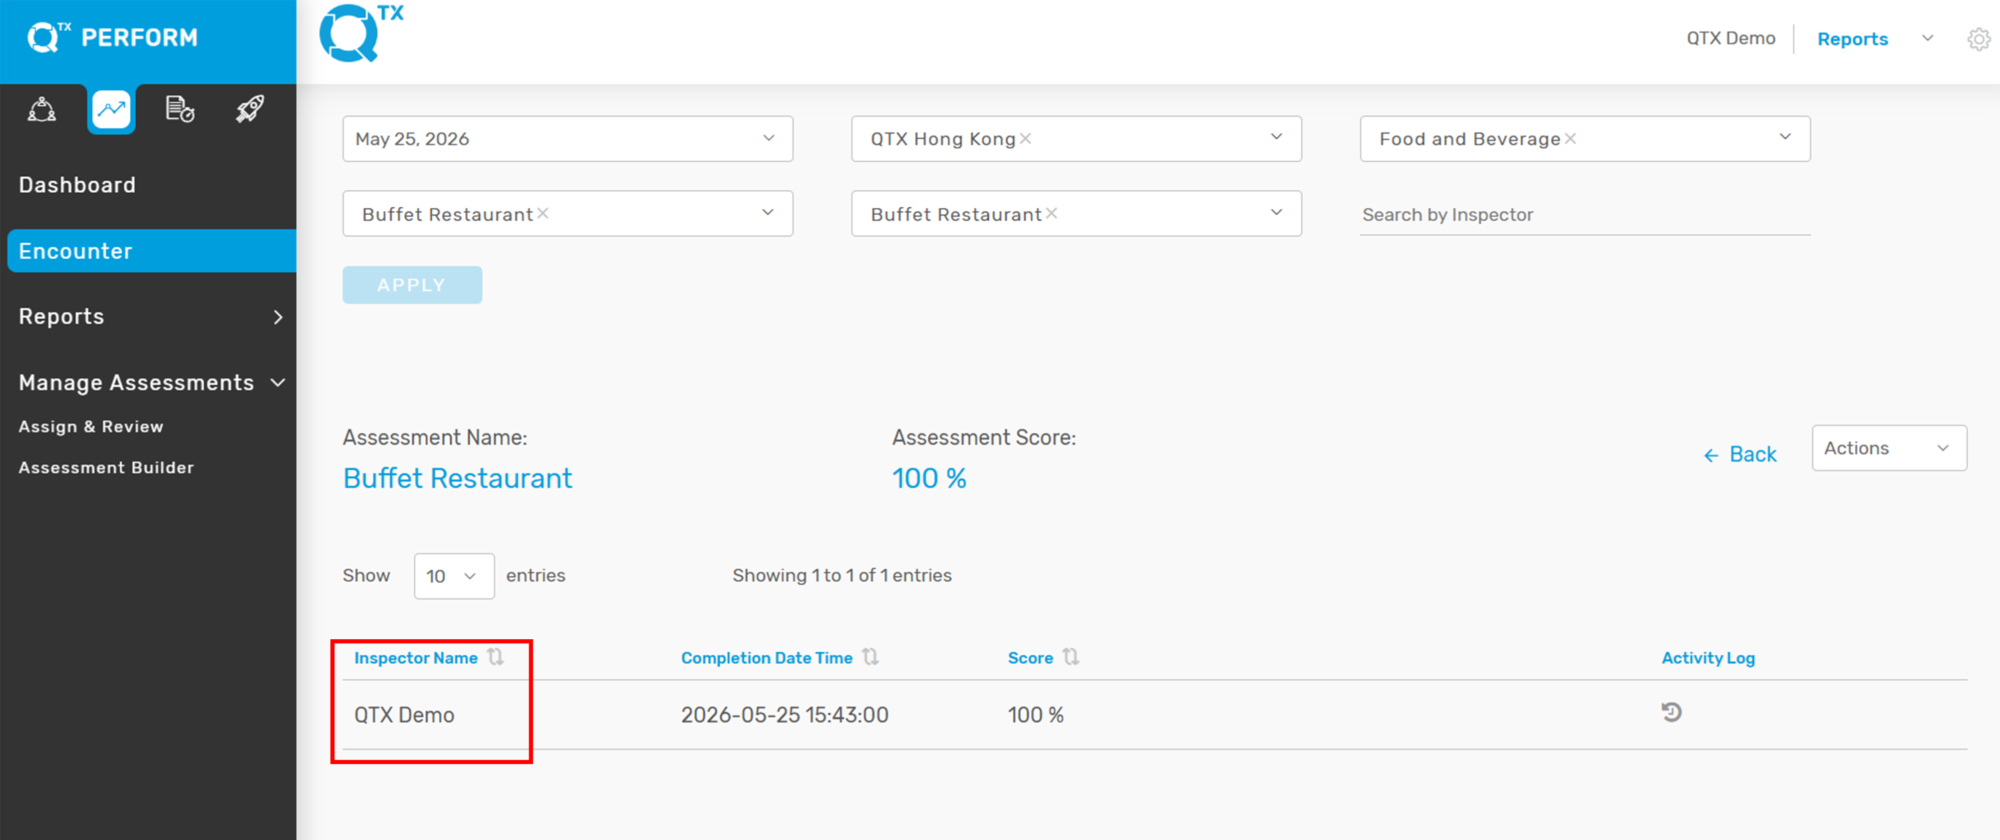
2. For example, the Buffet Restaurant and the Inspector is QTX Demo.


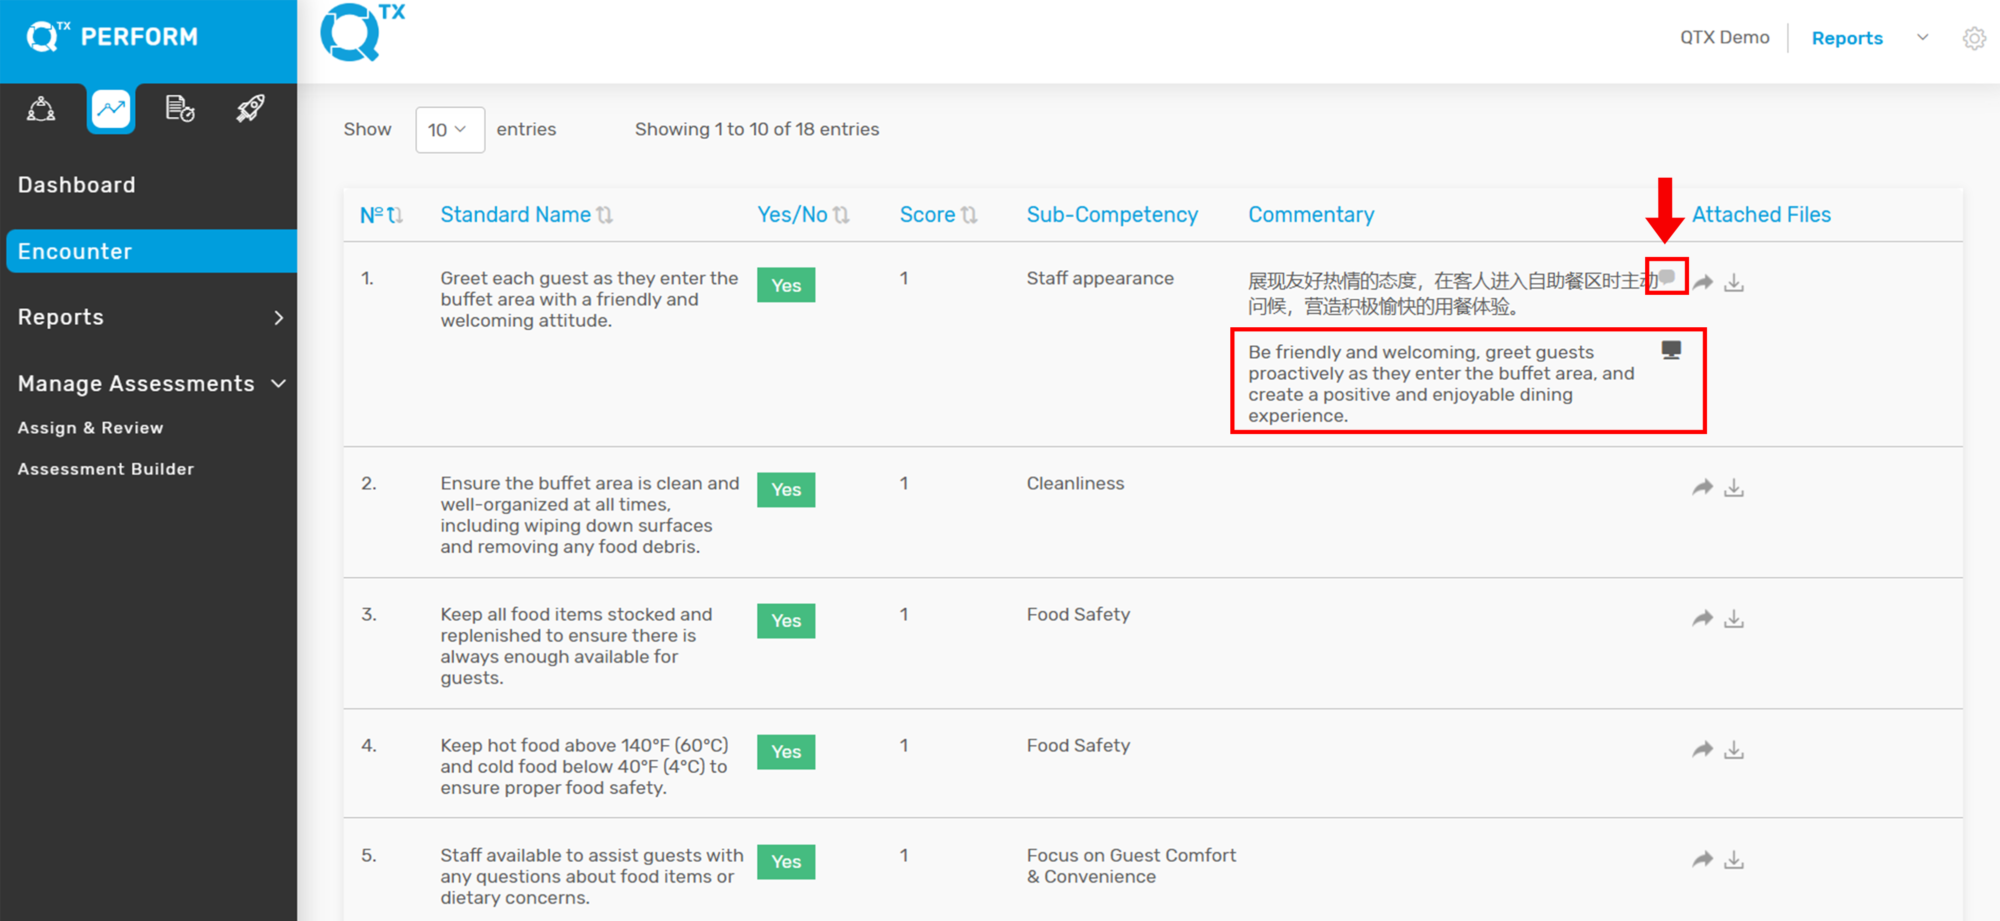
3. Locate the Translation icon beside the comment section. Click the Translation icon to display the English translation.


The same functionality is also available in the Standard Comment box.


If you need further assistance, please send an email to helpdesk@q-tx.com

Perform: How to View List of Completed Assessments and How to Edit Assessment in Encounter Report

The Encounter Report feature in QTX Perform allows team leaders, inspectors, and champions to track and review employee evaluations. These assessments are essential for monitoring job performance, recognizing achievements, and identifying areas for improvement.

Each submitted assessment provides a detailed breakdown of standards, inspector comments, and timestamps. In cases where an update or correction is needed, authorized users (e.g., Champions) can edit the report to ensure accuracy and data integrity.

This guide walks you through the steps to view completed assessments and edit existing records in the Encounter Report section.


1. Click on the PERFORM module and select the ENCOUNTER tab.


2. Use the filter options to search for specific assessments (e.g., by date, location, section and department, or assessment name).


3. You’ll see a list of assessments with their names and overall scores. Click an Assessment Name (like “Check In Test”) to view its full report.


📎 Clip Icon Meaning: A paperclip icon next to an assessment means there are files attached. Click it to see or download them.


4. On the Encounter page, after choosing your filters (like date and location), you’ll see a list of assessments.

The Assessment Name & Score (e.g., “Check In (test)”) and its overall score are at the top, giving you a quick summary of how that assessment performed.

Below this, the table shows individual results by Inspector Name (pointed out by the red arrow). Each line tells you who finished the assessment, when they did it, their score, and if there are any attached files. You can click on an inspector’s name to see their detailed results.

This setup helps you easily track and compare how individuals and groups are performing.

Activity Log Feature

5. When you open an Encounter Report, you’ll see a summary:
Report Title: The name of the assessment (like “Check In”).
Instructions: Special tasks for the audit.
Submitted: When the report was sent.
Overall Comment: A general note on performance.
Attached Files (red arrow): Pictures or videos linked to the comment.
This section quickly shows the report’s key details and any attached files.


6. This section provides users with a quick overview of the assessment’s timing, person assessed, and session details.
Assessment Date & Time: Shows the start and end dates (e.g., June 17, 2025) and times (e.g., 12:07 PM to 12:08 PM), helping to track duration.
Attributes: Includes the Team Member Name (Auditee) (e.g., Jeralyn) and Room Number (e.g., 2046) associated with the assessment.
Shift / Period: Indicates the time of day the assessment occurred (e.g., Afternoon).
Tip: Make sure the shift period matches the actual time of the assessment for reporting accuracy.


7. The image displays a detailed assessment report, highlighted by a red box at the top, showing columns for “â„–”, “Standard Name”, “Yes/No”, “Score”, “Segment”, “Commentary”, and “Attached Files”. An arrow specifically points to a “No” in the “Yes/No” column and a “0” in the “Score” column for a particular standard, indicating that this specific standard was not met during the assessment. The “Commentary” section next to it provides an explanation for the missed standard.


8. If you need to update or revise details in an existing Encounter Report, follow these steps:
On the top right section of the report page, find the “EDIT” button.
It is highlighted in blue and located beside the “VIEW HISTORY” button.
Click on the “EDIT” button (see red box and arrow in the image) to enter the editing mode.


9. Once in edit mode, you can modify fields such as:
Overall Comments
Overall Attached files
Assessment Date and Time details
Attributes ( Team Member Name (Auditee), Shift/Period, Room Number)

Yes/No Selection
Commentary
Attach File per Standard


10. Save Your Changes: After editing, make sure to save the report by clicking the Finish button to apply your changes.


If you need further assistance, please send an email to helpdesk@q-tx.com

How to Download QR Code as a Group User

The main advantage of a QR code is its versatility. This is beneficial for both Management and Inspector and it is easy to distribute by just downloading a code.


1. When you are on the Dashboard landing page, click on the “LAUNCH” button.


2. Click on the “Assessments” button, then select “Builder” from the dropdown menu.


3. To download the QR code for a specific assessment, simply click the “Download” button beside the assessment name. This QR code allows users to quickly access the assessment using a mobile device. Make sure you select the correct assessment before downloading. You can scan the downloaded QR code to test if it directs you to the correct assessment page.


4. The downloaded file normally appears in the upper right corner of your screen.


5. Click on the downloaded file and the QR code image will appear.


If you need further assistance, please send an email to helpdesk@q-tx.com
Launch: How to View the Encounter Report by Competency, Sub-Competency, and Category

The Encounter Report provides a detailed evaluation of the department’s service performance, as assessed by the Inspector using standardized criteria. Users can view the report from different perspectives—by Competency, Sub-Competency, or Category—to gain deeper insights into specific areas of strength and opportunities for improvement. This helps teams better understand performance from the customer’s point of view and take action to enhance overall service quality.


1. On the Dashboard landing page, click the “LAUNCH” button to proceed.


2. Click the “Encounter” button, then complete the required details in the Filters section.


3. Fill in the required details in the Filters section. The Overall Score will then be displayed in percentage format based on the selected Assessment Period.


4. Click on any Assessment Period to view the list of completed assessments submitted by Inspectors.


5. Click on the Inspector’s name to view the Encounter Report. The report will be displayed in its default view.


6. After clicking the Inspector’s name, the Encounter Report will open in its default view.


7. To view the Encounter Report by competency, click “VIEW BY COMPETENCY.” The report will then be displayed and organized according to each Competency.


8. To view the Encounter Report by sub-competency, click “VIEW BY SUB-COMPETENCY.” The report will then be displayed and organized according to each Sub-Competency.


9. Users can also view the Encounter Report by category. Simply click “VIEW BY CATEGORY” to display the report organized under each relevant category.
Note: Currently, only the default category is available.


If you need further assistance, please send an email to helpdesk@q-tx.com
Qualify: How to Create or Assign New Mystery Shopper as a Group User

To enable an Inspector to carry out an assessment, a Group User must assign access to the Inspector for the relevant Location, Section, Department, and Assessment. It is also important to specify the assessment period for effective monitoring. There is no limit to the number of mystery shops that can be conducted.


1. On the Dashboard landing page, click the “QUALIFY” button to proceed.


2. Click on “Assign Mystery Shop” under the “Mystery Shop” section, then select the “CREATE MYSTERY SHOP” button to begin.


3. To assign an assessment in the QTX Qualify module, go to Mystery Shop > Assign Mystery Shop, then fill out the form as shown. Select the Location Name and Inspector Name from the dropdown menus. If needed, check the Send Email Notification box to alert the inspector via email. Next, choose or create the Assessment Period.


4. Once all fields are completed, click Assign to finalize the assignment.


If you need further assistance, please send an email to helpdesk@q-tx.com
Qualify: How to View Executive Summary Report

This report provides a summary of key features related to the department’s performance, offering management a concise overview without the need to review each individual report in detail.


1. On the Dashboard landing page, click the “QUALIFY” button to proceed


2. Click on the ‘Executive Summary’ button under the ‘Reports’ section, then complete the required details using the available filters.


3. This Image displays key competency metrics such as Customer Service and Professionalism, along with a Performance Summary chart that visually compares overall performance scores, such as Hotel Services. This section provides a quick and clear overview of team and department performance.


4. The chart indicates how many percentages are achieved, not achieved, and N/A. This summary helps users quickly assess performance outcomes. Below the chart, there’s a section labeled Summary Comments where detailed observations or feedback can be added.


If you need further assistance, please send an email to helpdesk@q-tx.com
Qualify: How to View and Edit the Encounter Report as a Group User

Mystery Shoppers evaluate the department’s service performance based on standard criteria, providing valuable insights into how customers perceive the company. This feedback helps identify areas for improvement. Group Users have the ability to edit the report, allowing them to manage and refine the assessment details as needed.


1. On the Dashboard landing page, click the “QUALIFY” button to proceed.


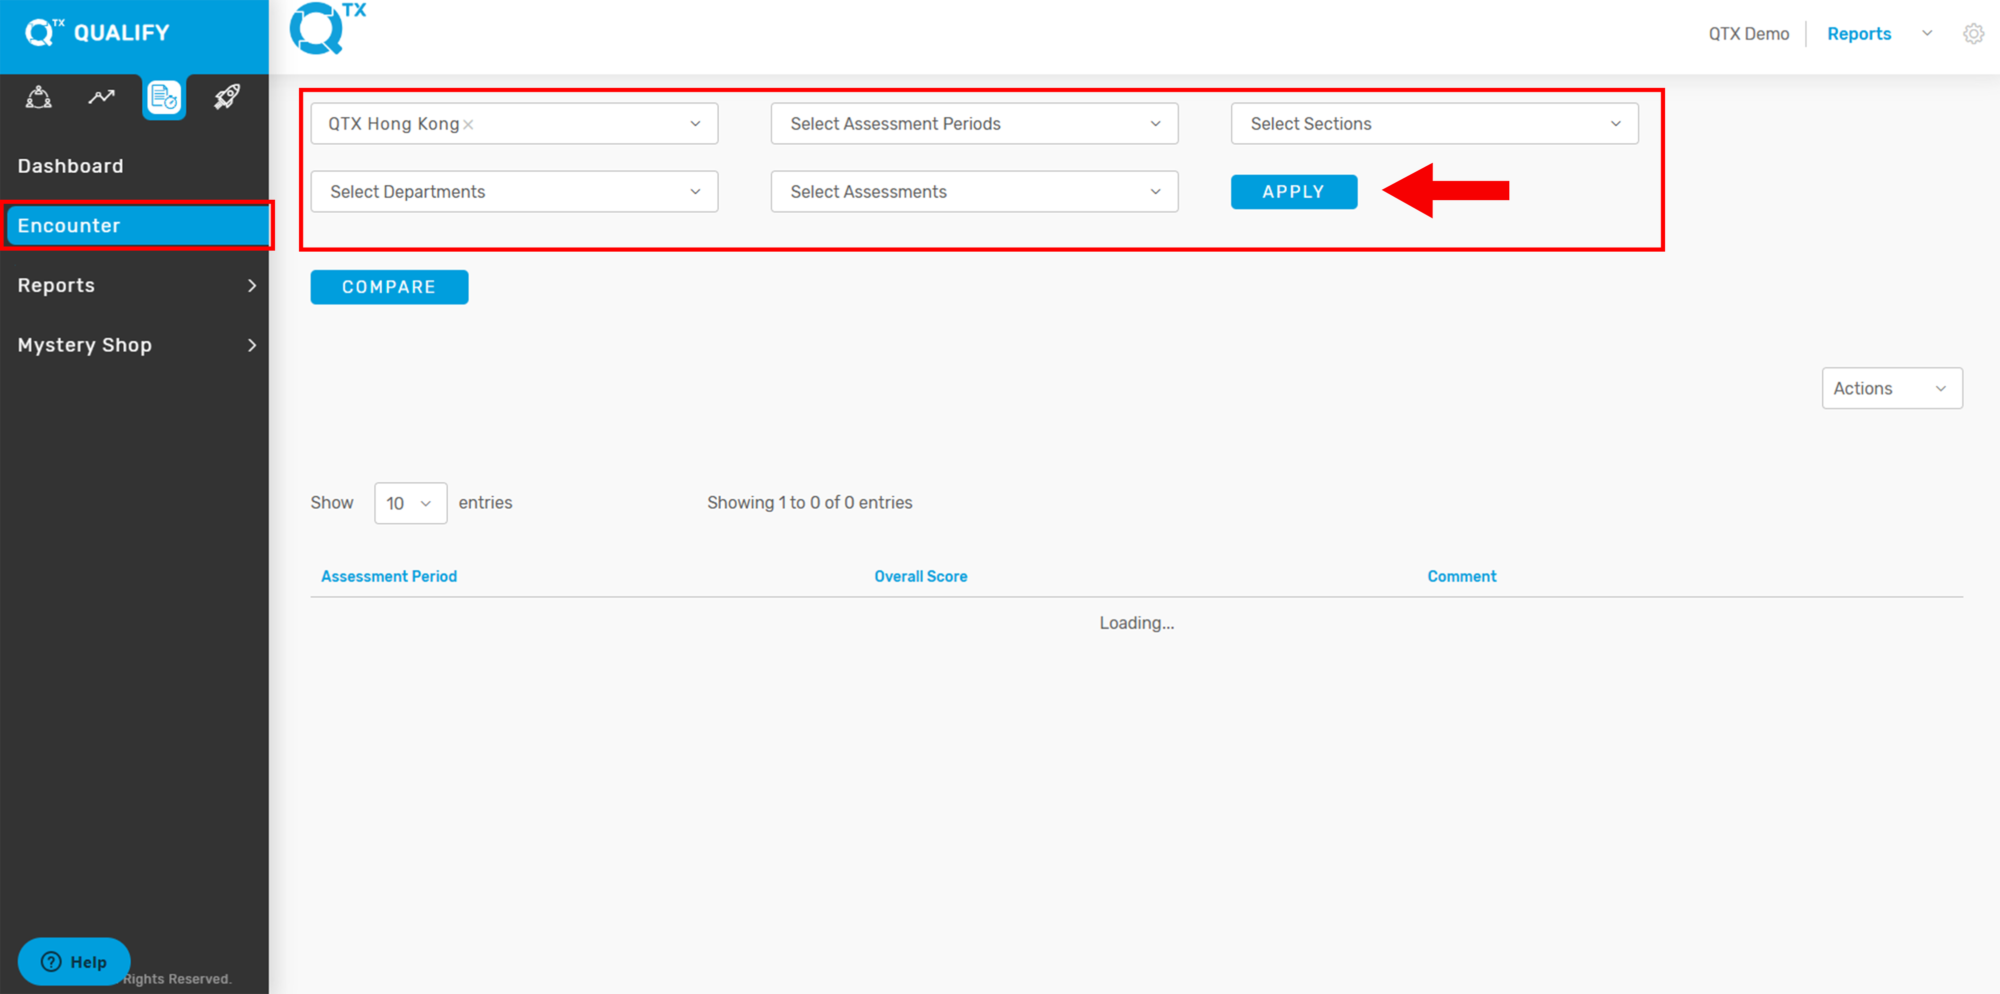
2. Click on the “Encounter” button located on the left-side menu. Once the page opens, fill in the required details in the Filters section to narrow down and view specific assessment results or encounter records. Click “Apply Button”.


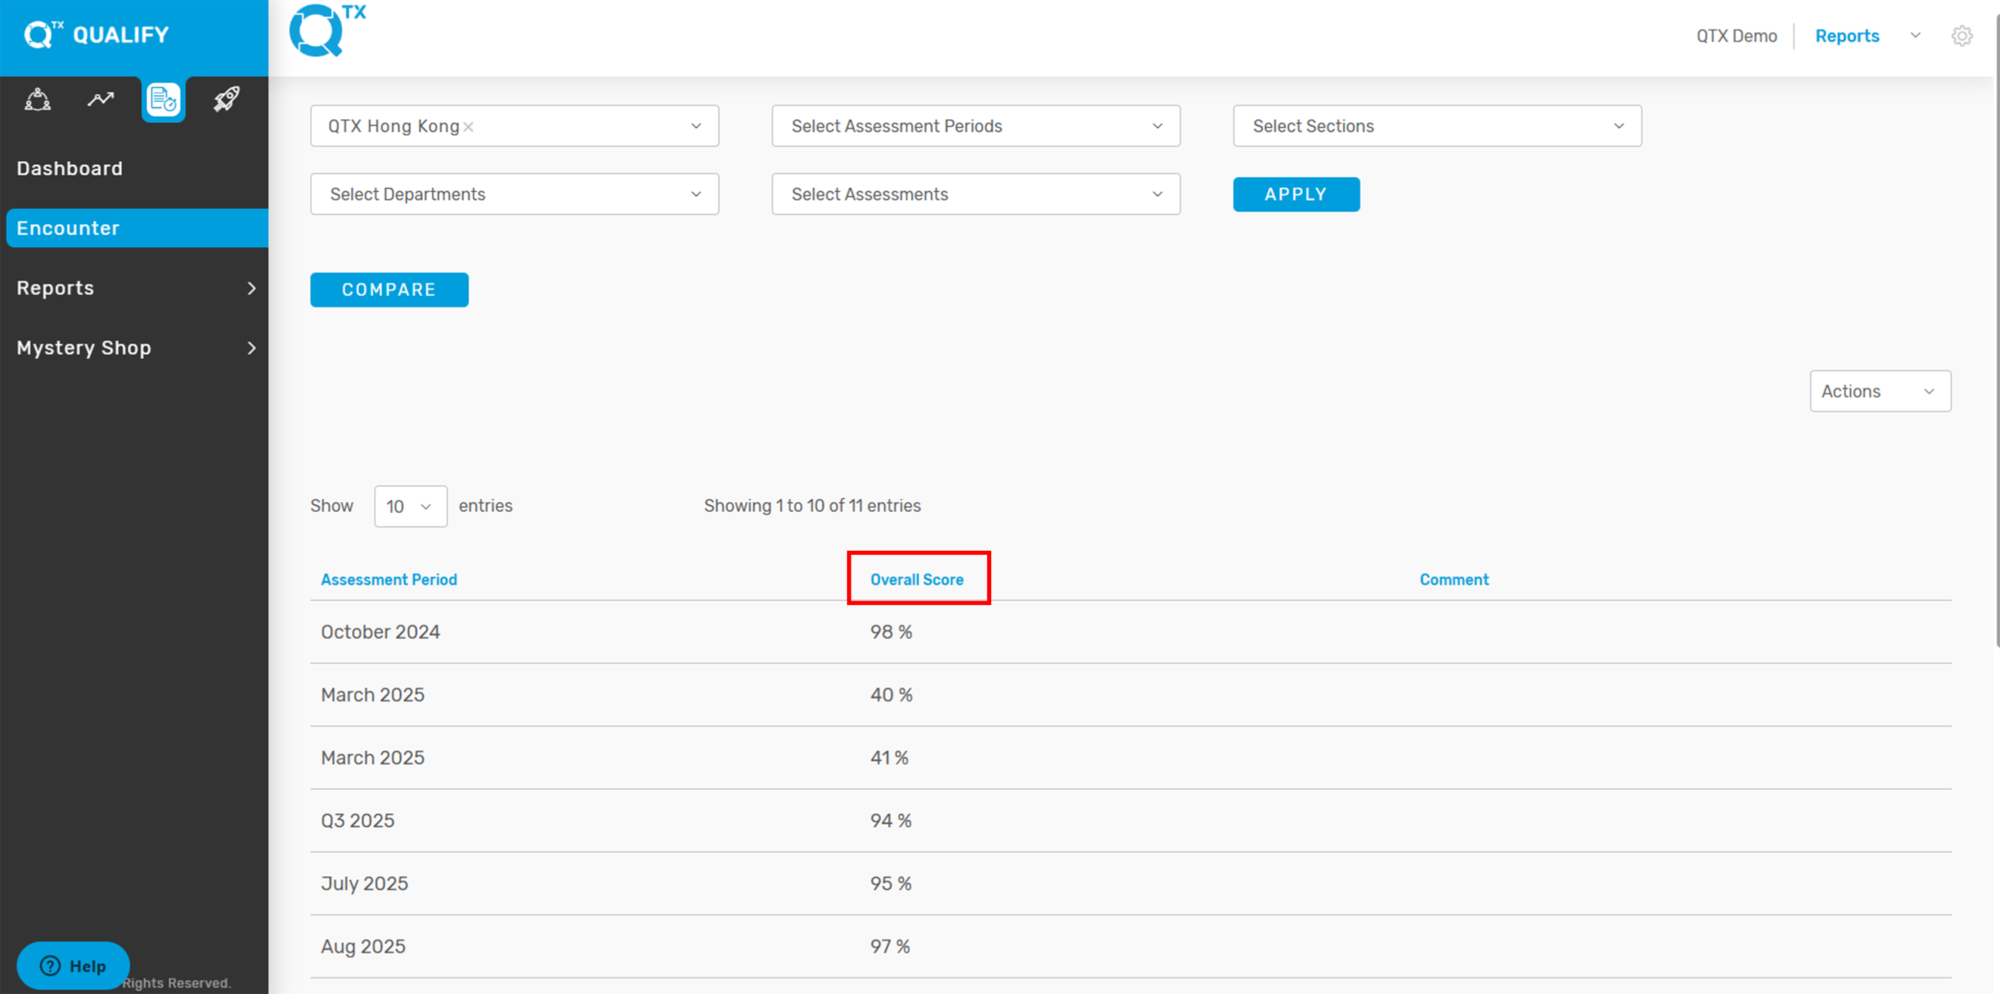
3. The Overall Score will be displayed as a percentage based on the selected Assessment Period, providing a clear summary of performance during that specific timeframe.


4. Click on “Assessment Periods” to display the available assessment names associated with that period, as shown in the example below. This allows users to select and view specific assessments conducted within the chosen timeframe.


5. Click on the Assessment Name to open and view the Encounter Report. The report will be displayed in its default view, showing key details such as inspector comments, scores, and assessment criteria.


6. Users can view the Encounter Report organized by Competency for a more structured analysis. Simply click on “VIEW BY COMPETENCY”, and the report will automatically display the results grouped under each specific competency category.


7. Click on the “Edit” icon to make changes to the Encounter Report. This function allows authorized users to update report details, ensuring accuracy and completeness of the assessment data.


8. The user can directly edit the Overall Comment by typing in the provided text box and can also upload or replace the Overall Comment Attachment as needed. This feature ensures that final observations and supporting documents can be updated efficiently.


9. The Assessment Date and Time fields are editable, allowing users to update or correct the start and end dates and times of the assessment to reflect the actual period it was conducted.


10. Answer “YES” or “NO,” and the score can be adjusted. The user may also fill in or edit the “Commentary” box and upload a file if needed.


11. Click on the “Finish” button to save all changes made to the assessment.


If you need further assistance, please send an email to helpdesk@q-tx.com
Qualify: How to View the Encounter Report

Mystery Shoppers assess the department’s service performance based on standard criteria. Their feedback helps identify areas for improvement by providing insight into how customers perceive the company.


1. On the Dashboard landing page, click the “QUALIFY” button to proceed.


2. Click on the “Encounter” button located on the left-side menu. Once the page opens, fill in the required details in the Filters section to narrow down and view specific assessment results or encounter records.


3. The Overall Score will be displayed as a percentage based on the selected Assessment Period, providing a clear summary of performance during that specific timeframe.


4. Click on Assessment Period to display the available “Assessment Names” associated with that period, as shown in the example below.


5. Click on the Assessment Name to open and view the Encounter Report. The report will be displayed in its Default view, showing key details such as inspector comments, scores, and assessment criteria.


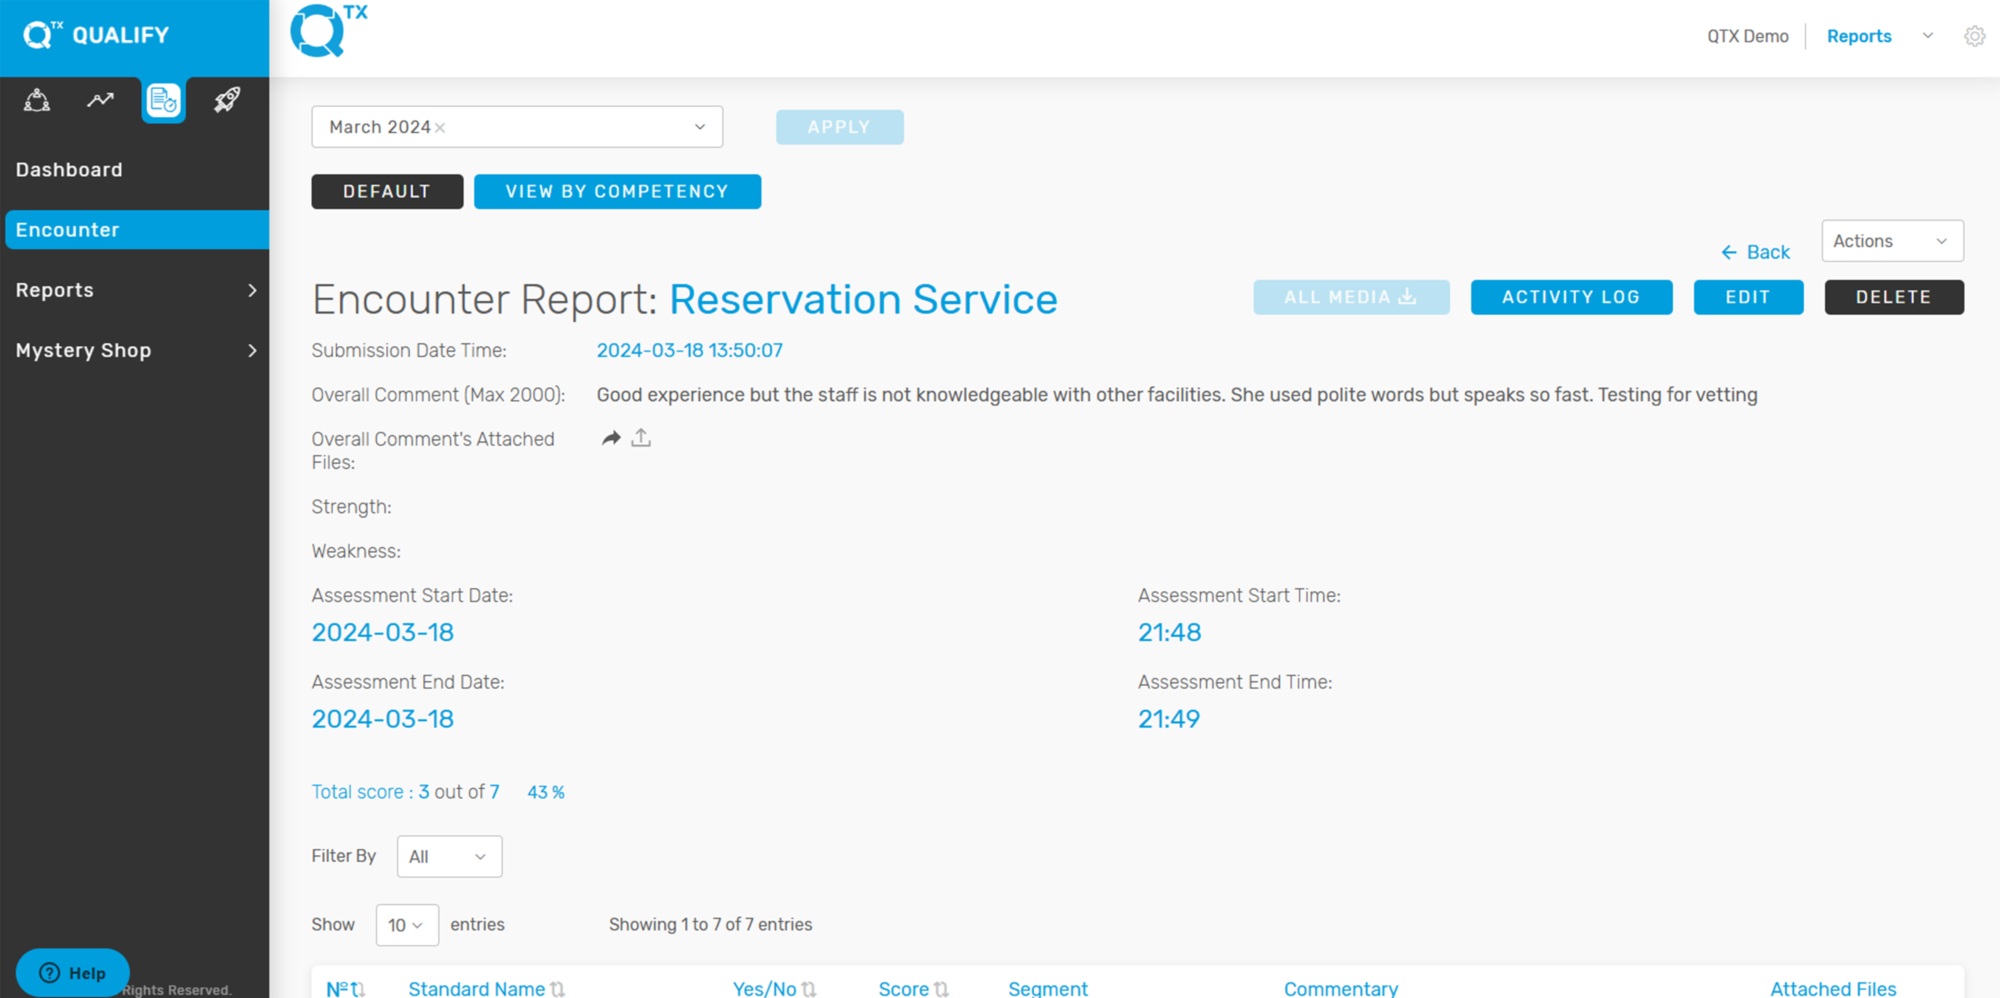
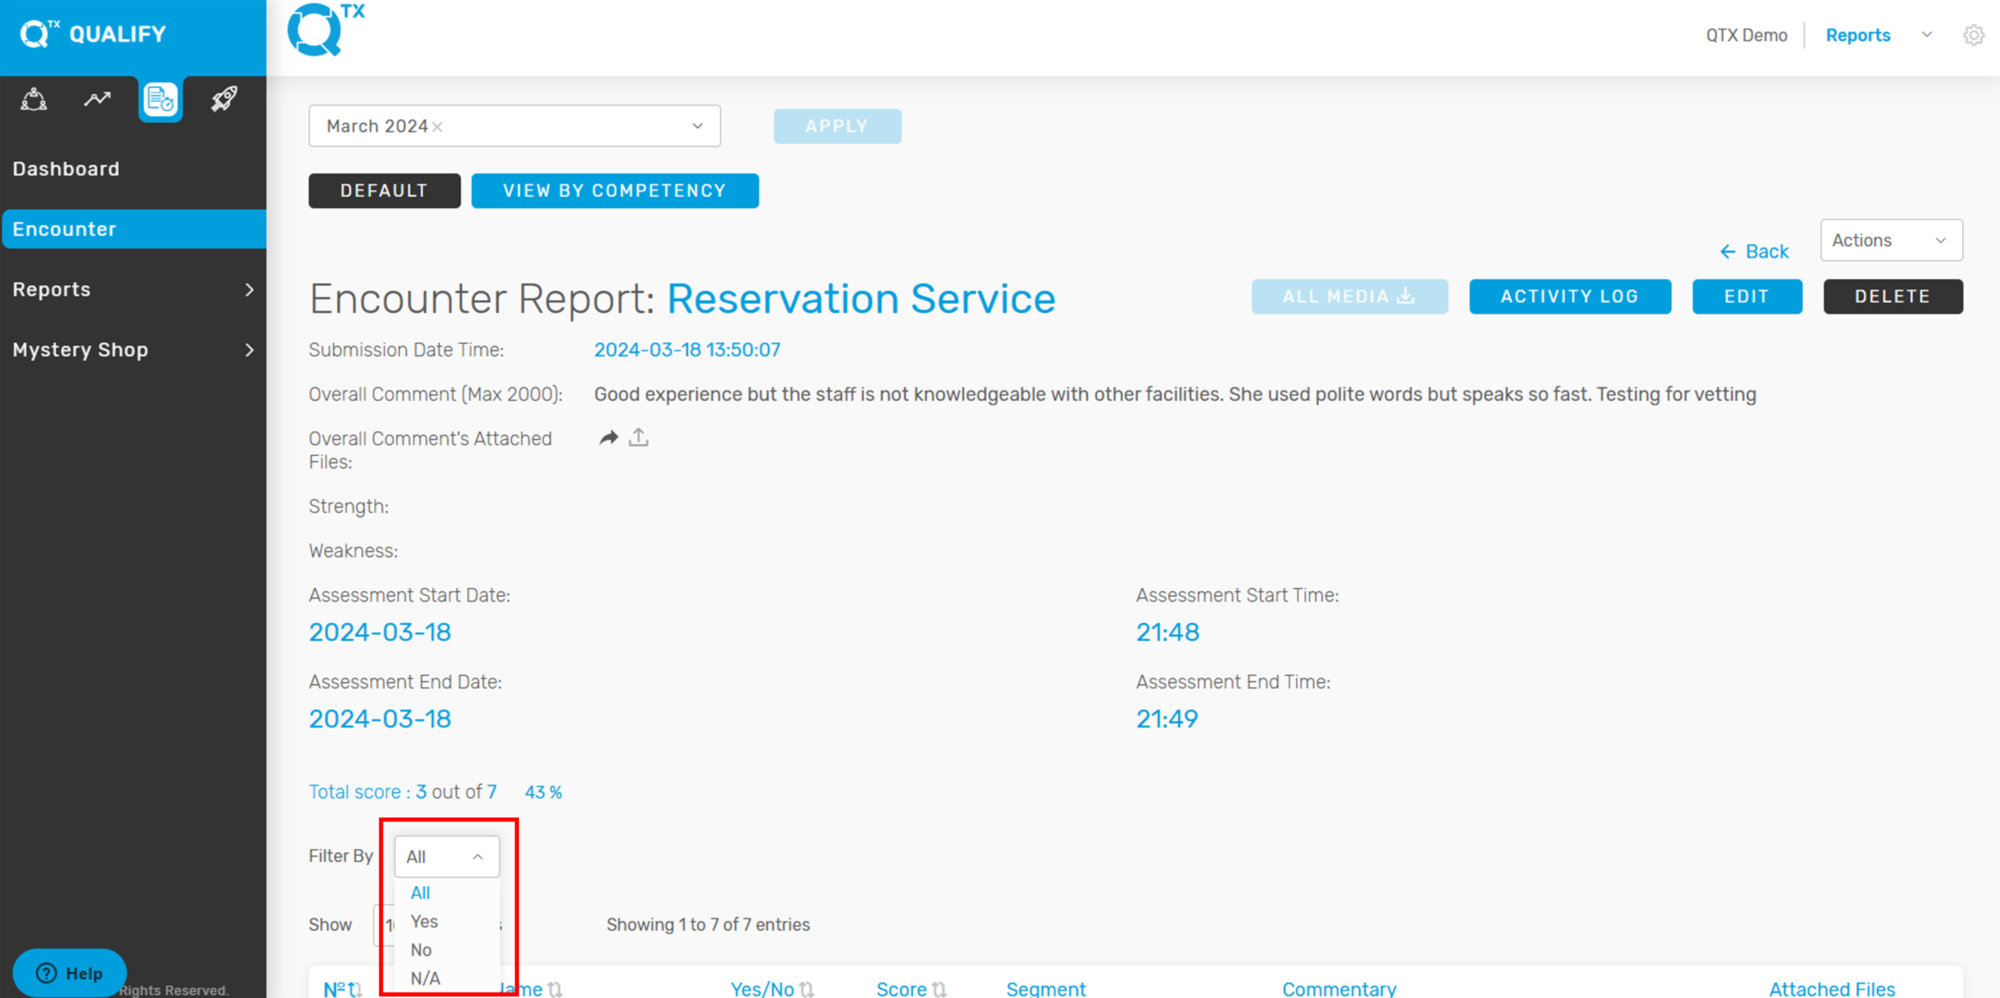
6. The user can view this filter in the Default view, which allows them to display all Yes, No, or N/A responses on a single encounter page.


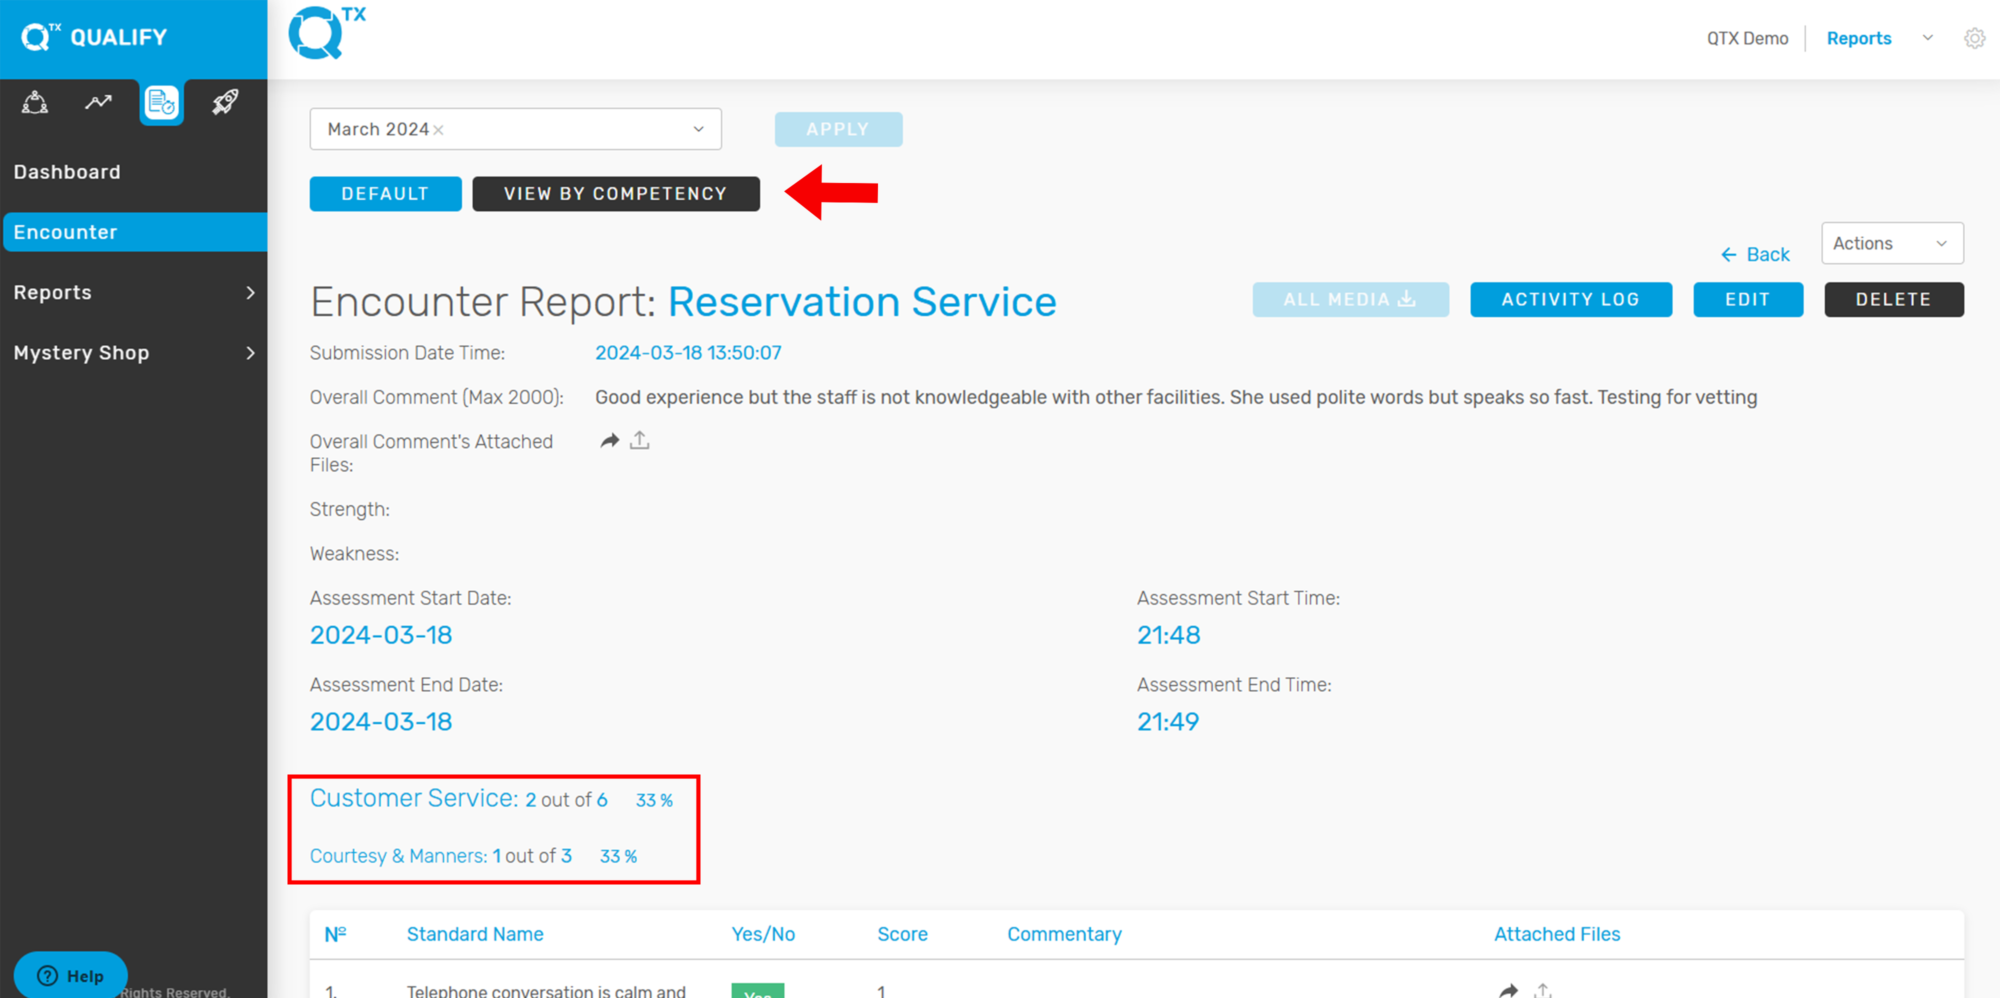
7. Users can view the Encounter Report organized by Competency for a more structured analysis. Simply click on “VIEW BY COMPETENCY”, and the report will automatically display the results grouped under each specific competency category.


If you need further assistance, please send an email to helpdesk@q-tx.com
Qualify: How to View Top 10 Missed Standards and Top 10 Achieved Standards

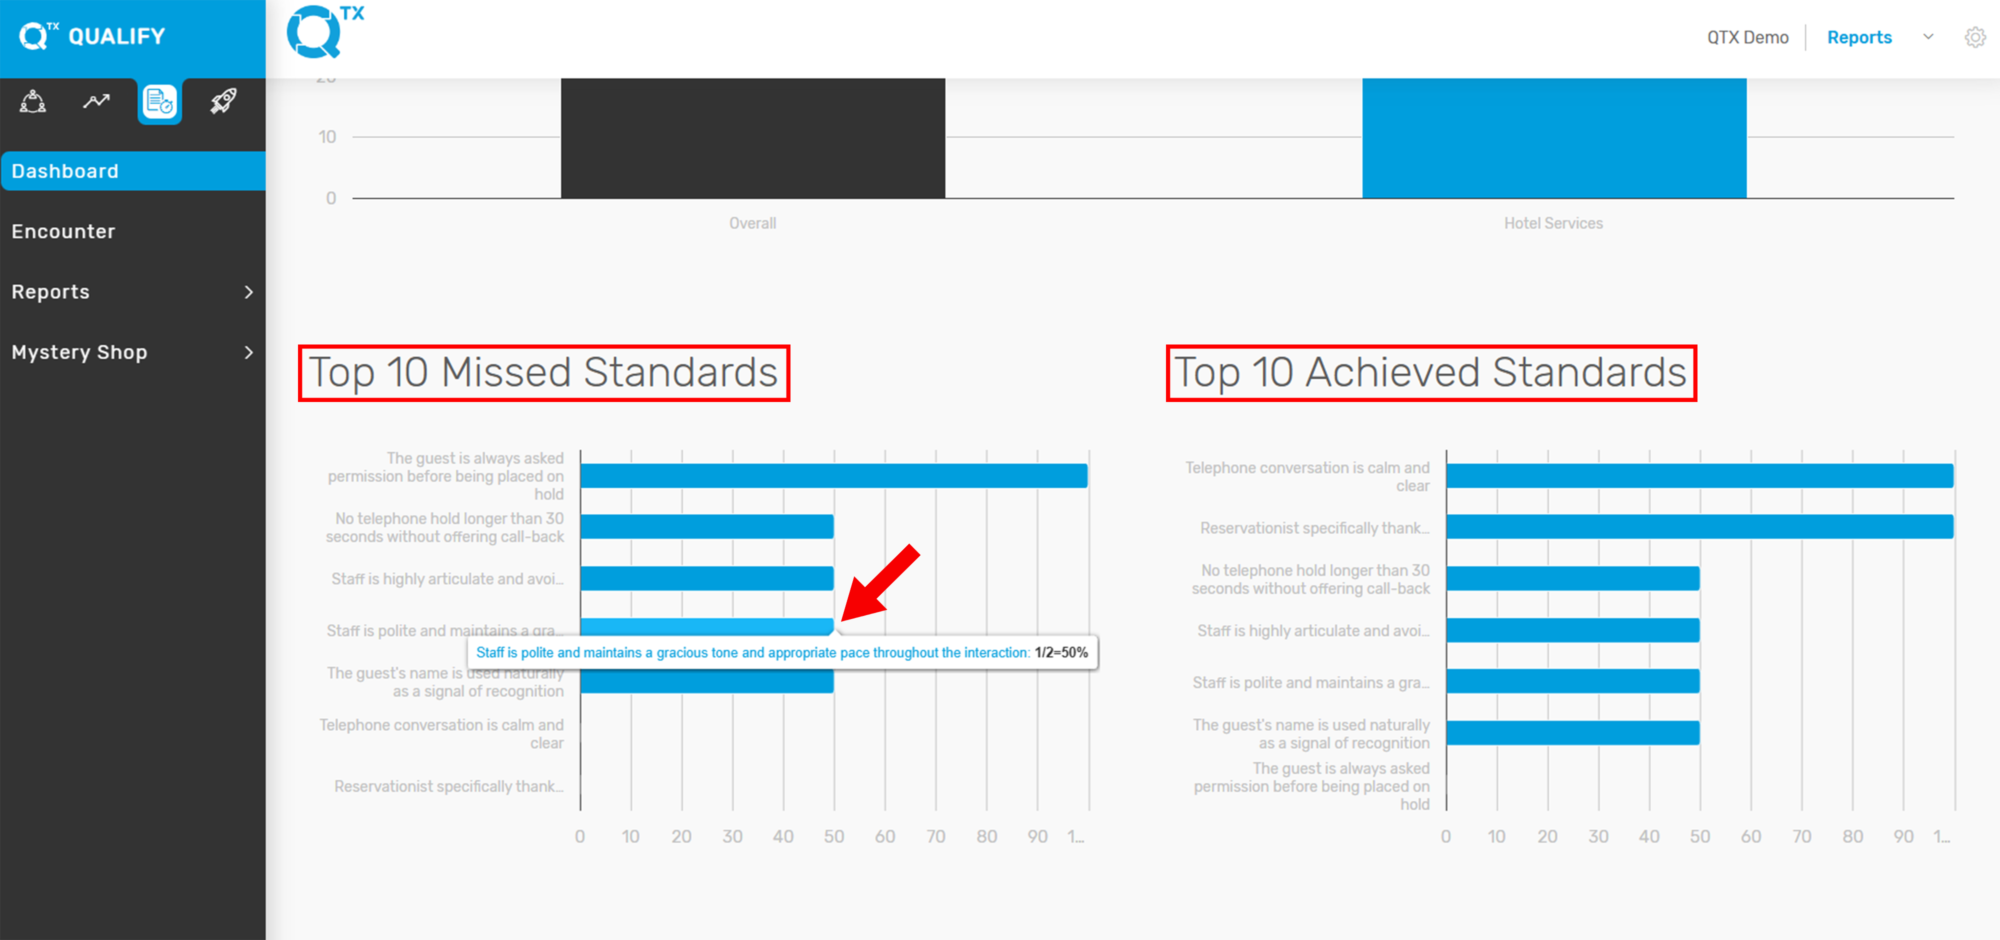
Viewing the Top 10 Missed or Achieved Standards provides valuable insights for management, highlighting which departments consistently meet expectations and which require improvement. This allows for targeted performance optimization, ultimately contributing to better operational outcomes. Understanding when to strictly enforce standards and when flexibility is appropriate is essential to maintaining both efficiency and guest satisfaction.


1. On the Dashboard landing page, click the “QUALIFY” button to proceed.


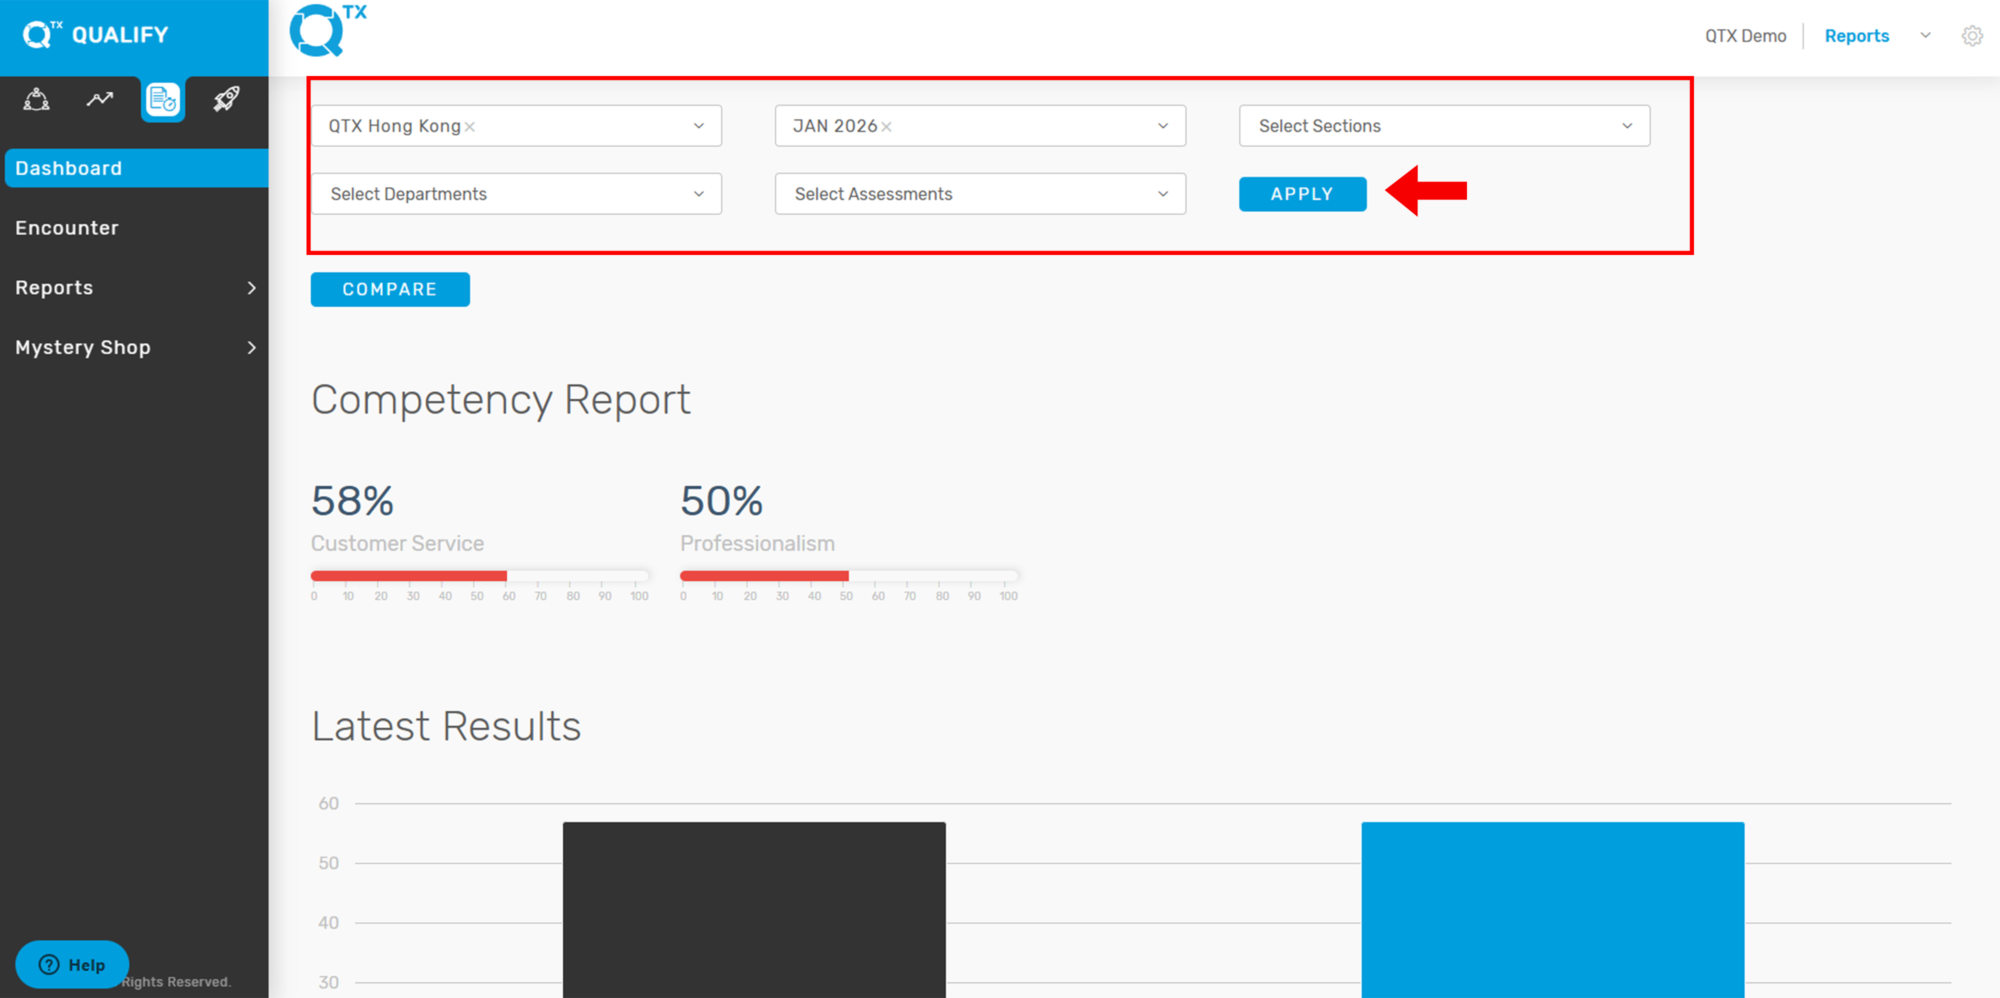
2. Fill out the required details in the Filters section, such as Location, Department, Section, and Assessment, to generate a focused and accurate report based on your selection criteria.


3. On the same page, scroll down to view the Top 10 Missed Standards and Top 10 Achieved Standards. Hover your cursor over any line on the graph to see detailed information, including the specific standard and its corresponding score.


If you need further assistance, please send an email to helpdesk@q-tx.com
Qualify: How to View Dashboard Reports

The QTX Platform is tailored for hotels to create cost-effective, results-driven mystery shopping programs that align with their specific operational needs. Each report is purpose-built for hotel environments, enabling teams to quickly identify and address recurring issues to enhance service quality and operational efficiency.


1. On the Dashboard landing page, click the “QUALIFY” button to proceed.


2. Fill out the required details in the Filters section, such as Location, Department, Section, and Assessment, to generate a focused and accurate report based on your selection criteria.


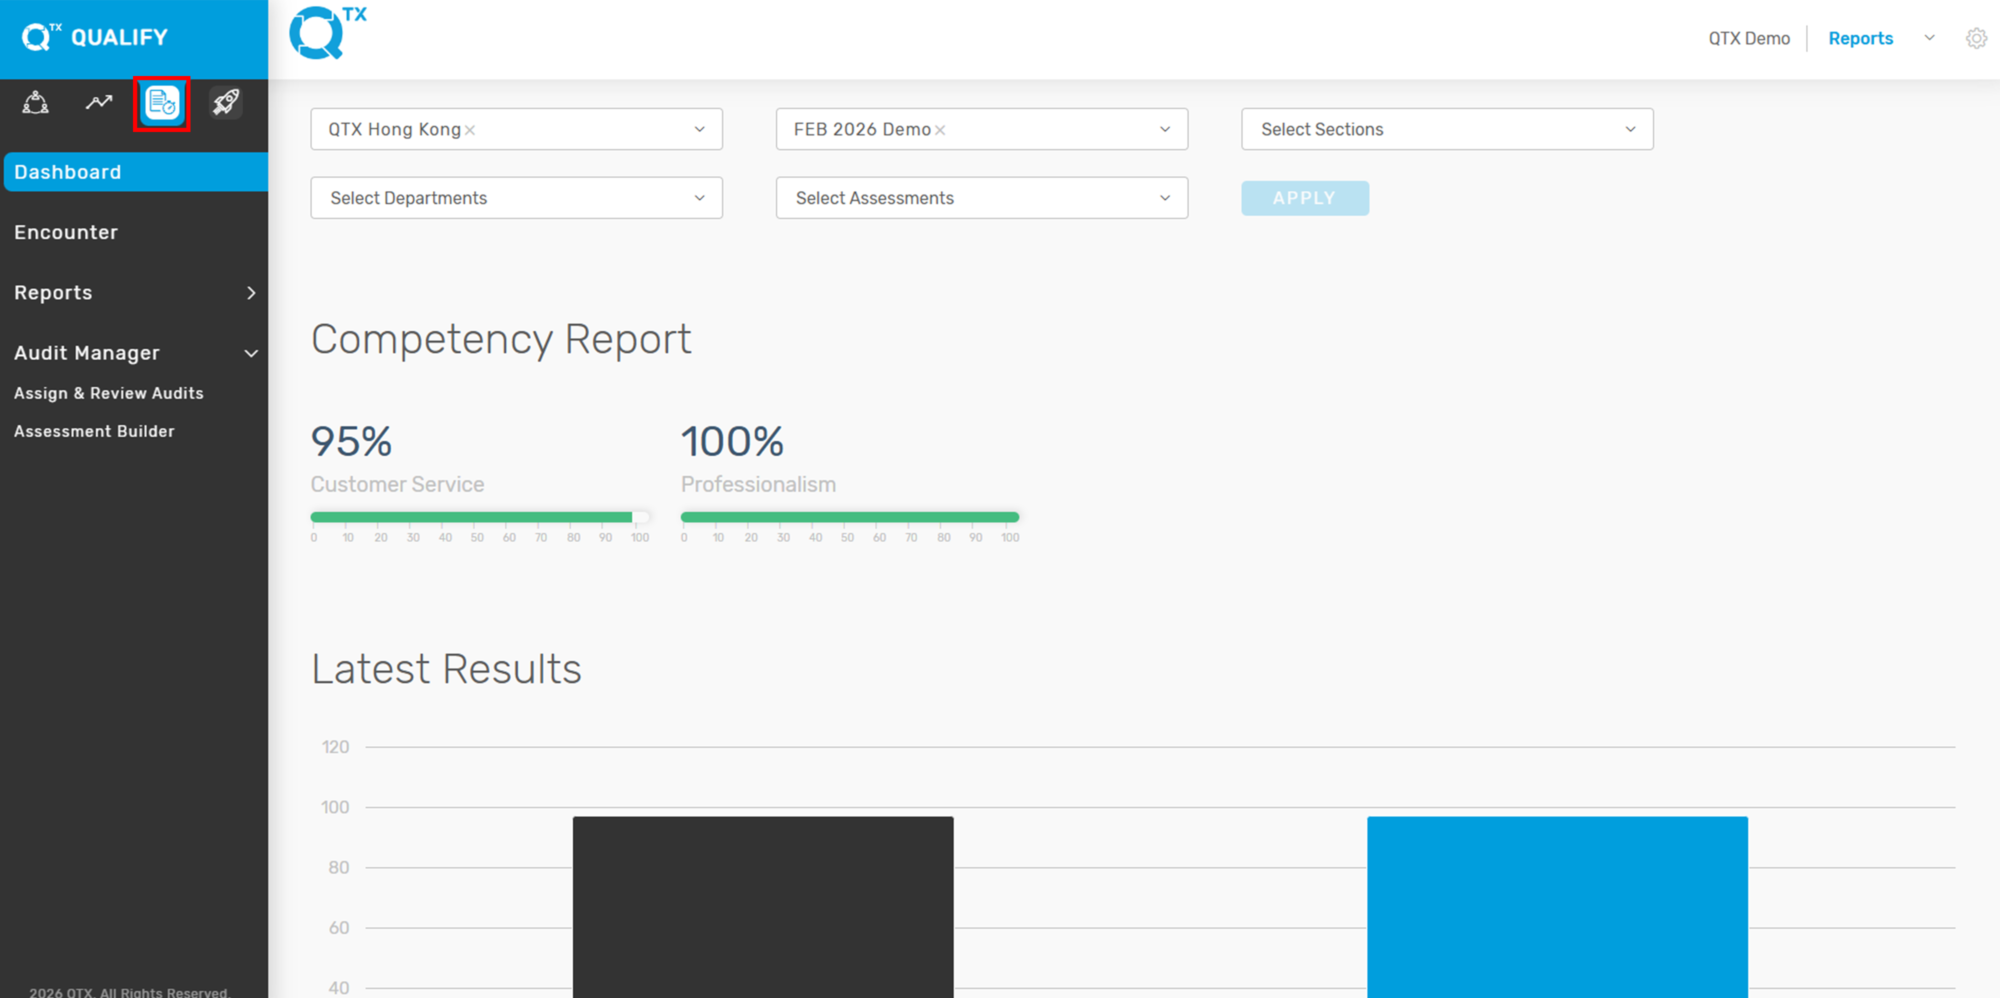
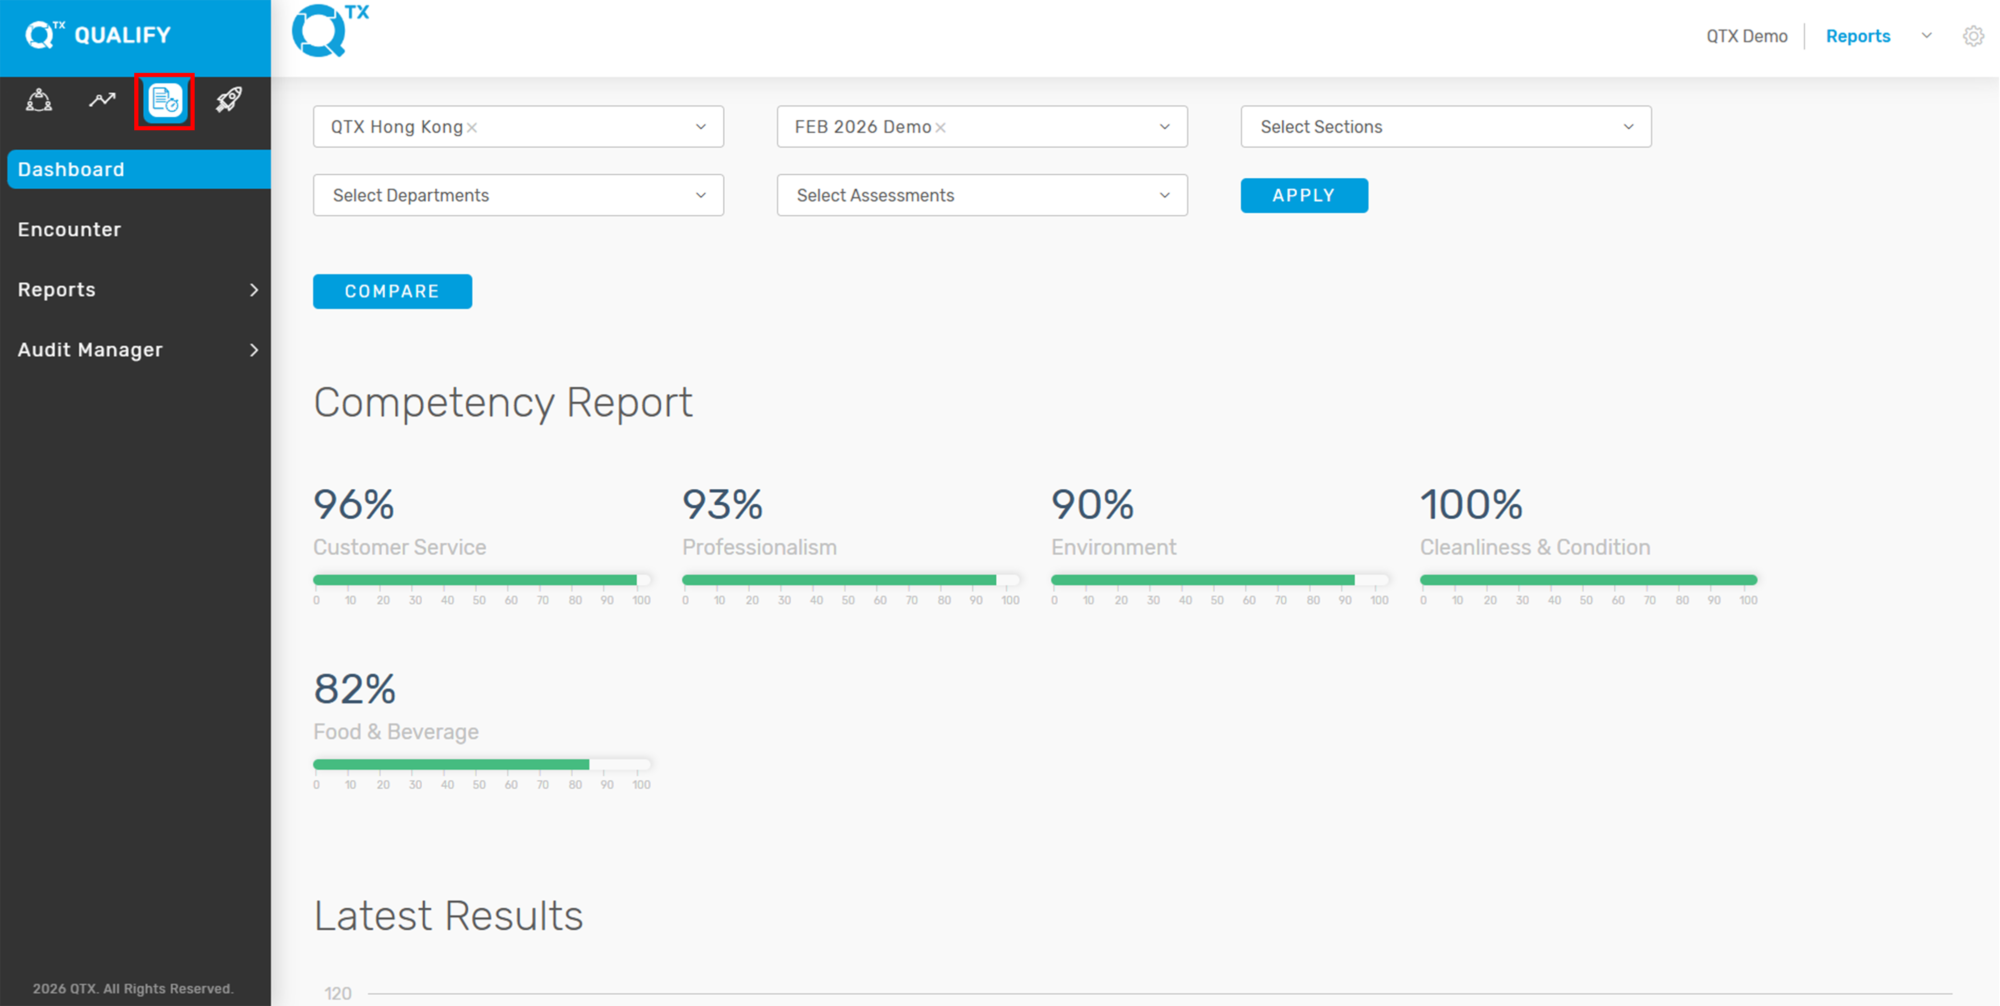
3. On the same page, scroll down to view the reports. The Competency Report displays percentage scores categorized by Competency. Any score below 80% will appear as a yellow graph line, making it easy to identify areas needing improvement.


4. The Latest Results section displays the most recent score for the selected Location. Hover your cursor over the bars on the graph to view the exact percentage score.


5. You can view the Top 10 Missed Standards and Top 10 Achieved Standards, each displayed with its corresponding scores to help identify areas of improvement and success. You can also view the standard by hovering the cursor.


If you need further assistance, please send an email to helpdesk@q-tx.com
Connect: How to Reply Guest Response as a Group User

This functionality allows you to view each guest’s response and communicate with them either automatically or manually through the QTX Connect platform.


1. From the dashboard landing page, click on Reports under the CONNECT platform.


2. Click on Response Analyses under Reports, then select the Problem Resolution tab. Next, fill out the required information in the filters.


3. This section displays resolution details and guest responses in a table format. Additional entries can be viewed by adjusting the number of entries shown or by clicking the page numbers at the bottom of the screen. To view a guest’s response, click anywhere on the guest’s row.


4. The system will display the full details of the guest’s response along with their stay information. To respond via email, click the envelope icon. (This action will redirect you to the Responses page.)


5. The guest’s email address is generated automatically. A default message will appear in the email body, which you can edit as needed. Use the scroll bar to view the full message. When you are ready to send, click the SUBMIT button.


If you need further assistance, please send an email to helpdesk@q-tx.com
Launch: How to Customize Assessments as a Group User

An assessment is a structured questionnaire used to evaluate the quality and standards of service in each section. It plays a key role in identifying performance levels and areas for improvement.


1. On the Dashboard landing page, click the “LAUNCH” button to proceed.


2. Click on the “Assessments” button, then select “Builder”.


3. Click on any Assessment to view or edit its contents.


4. The user can edit the title in real-time without navigating to the settings. Then, provide clear Assessment Instructions to guide users through the steps of the assessment. If needed, you can upload supporting files such as images, audio, or video by dragging and dropping them into the upload area.


5. The numbers at the top indicate the total number of standards included in this assessment. Each standard represents a specific question to be evaluated.
The red arrow points to the Assessment Attribute field, where you can enter or select specific details such as the Team Member Name (Auditee) to capture relevant information for each assessment entry.


6. From here, you will see the Standard Question along with two optional fields:
Placeholder – A temporary text field that indicates where and what type of content should be entered.
Question Guide – A short note or instruction that helps clarify how to properly answer the specific question.


7. Below, you can see the assessment items along with their corresponding Competencies and Sub-Competencies (if applicable). Each assessment item can be scored on a scale of 1 to 3.


8. The user can deactivate a standard if it is not necessary for the evaluation.

Note: Standards cannot be deleted if historical data already exists. To avoid potential issues, we recommend contacting Help Support for assistance with deleting, deactivating, or revising standards.


9. Assessments are predetermined by management and uploaded to the system by our development team. The “ADD QUESTION” function can only be used to place a new question at the end of the assessment. Click “NEXT” to navigate and view the remaining standards in the assessment.

Note: If a user needs to insert a question in between—which would alter the original order—they must submit the updated set of assessments to our team. This process helps ensure the integrity of historical data within the system.


If you need further assistance, please send an email to helpdesk@q-tx.com
Launch: How to View the Status of Assigned Assessments as a Group User

This report provides users with direct access to view inspector feedback and experiences. It also allows users to track the status of assigned assessments, indicating whether they have been started or completed.


1. On the Dashboard landing page, click the “LAUNCH” button.


2. Click the “Assessments” button, then select “Assignments” from the dropdown menu.


3. The assessment name will be displayed in a table format along with its corresponding “Status”.


4. A blue-highlighted “Action” button indicates that the assessment is active and ready to launch.


5. To view an assessment, click on the one with a “Completed” status. There are two types of status: “Completed” and “In Progress”.

“In Progress” means the assessment is still ongoing and has not been finished yet.


6. Users can access the Edit Assessment page, which is intended solely for updating the Start Date, Start Time, End Date, and End Time. After making changes, click “Assign” to save the updates.


7. To delete an unnecessary checklist, check the small box to the left of the assessment name, then click “DELETE”. You can view the remaining assessments by navigating to the next page.


If you need further assistance, please send an email to helpdesk@q-tx.com
Launch: How to View Number of Missed Standards Report by Competency

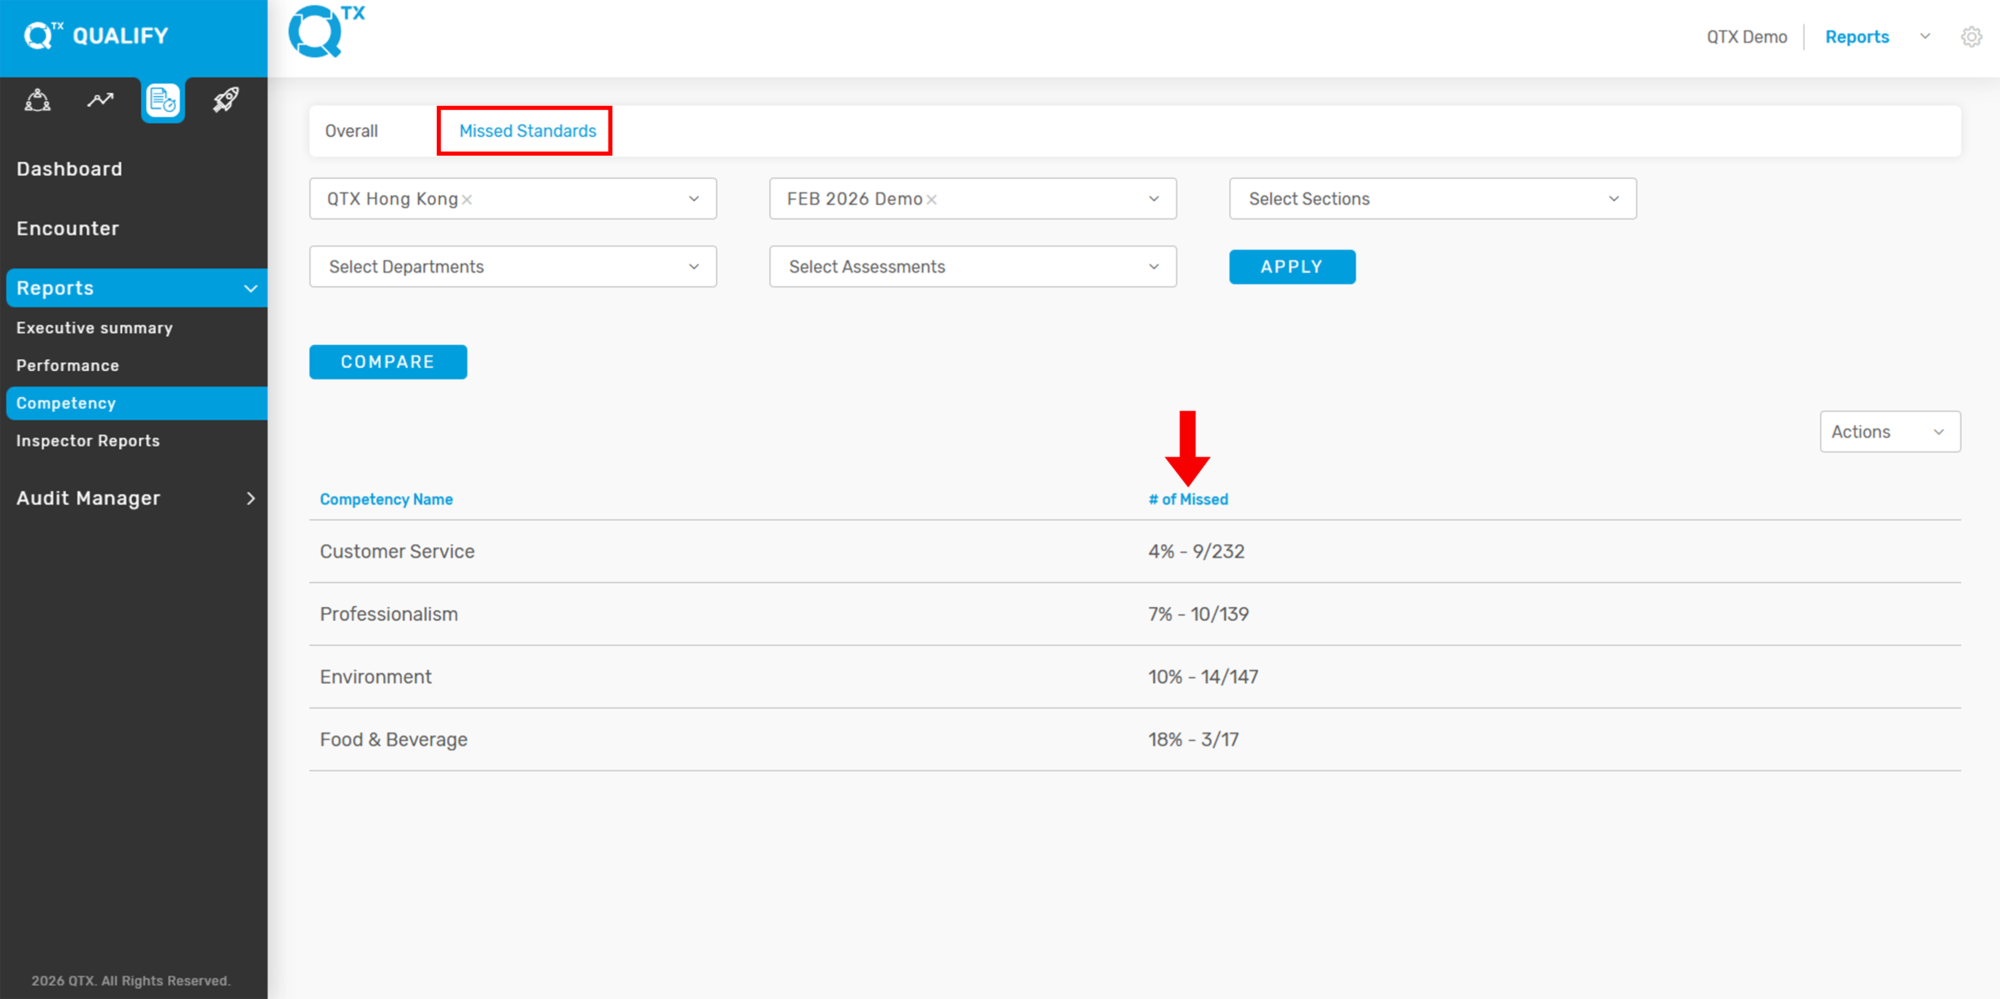
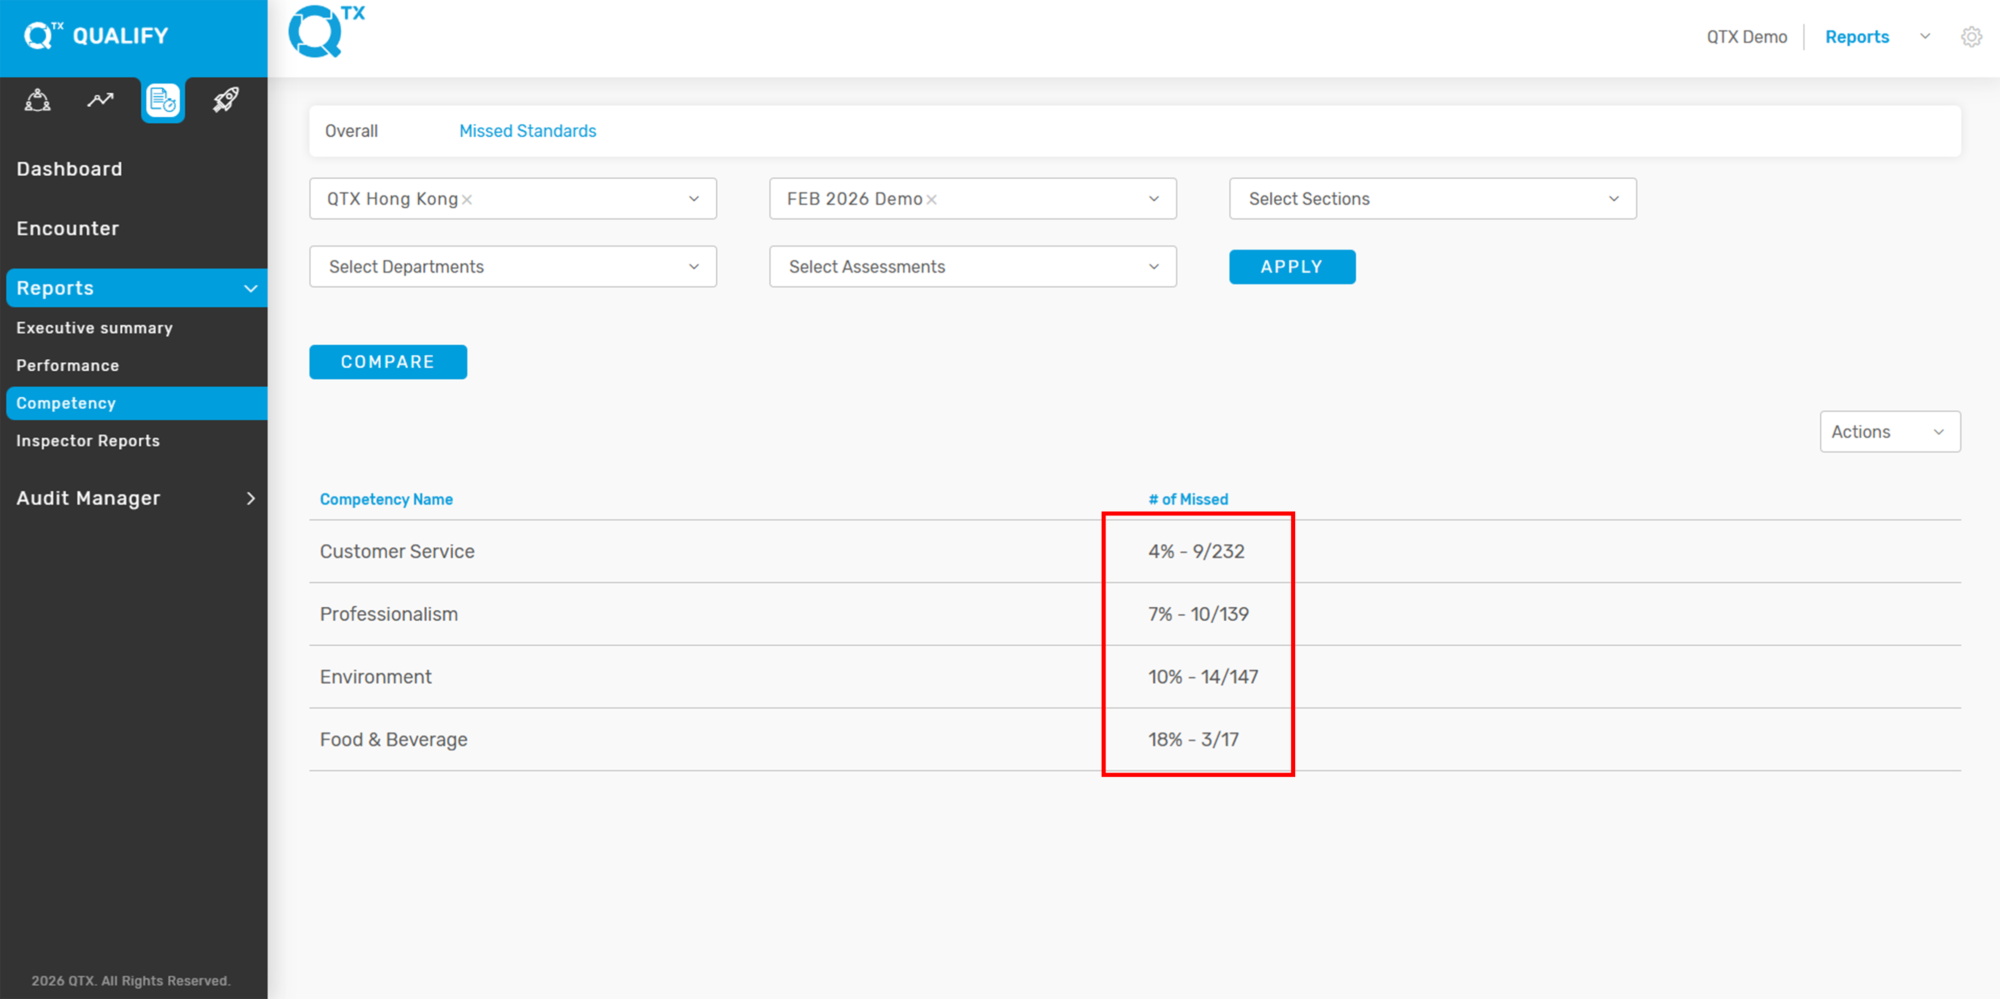
This report displays the percentage of missed standards categorized by competency.


1. On the Dashboard landing page, click the “LAUNCH” button.


2. Click the “Reports” button, then select “Competency” from the dropdown menu.


3. Click the “Missed Standards” tab, then click “VIEW ALL” to apply filters and view the complete list.


4. The report displays missed standards by both number and percentage, categorized by competency.


If you need further assistance, please send an email to helpdesk@q-tx.com
Launch: How to View the Overall Competency Report

Each standard represents a specific aspect of the guest experience, organized under a Competency and its corresponding Sub competency or Segment. This report provides a breakdown of Competency details by Location, Section, and Department.


1. On the Dashboard landing page, click the “LAUNCH” button to proceed.


2. Click the “Reports” button, then select “Competency” from the dropdown menu.


3. Make sure you are on the “Overall” tab. Then, use the available filters to select the desired information.


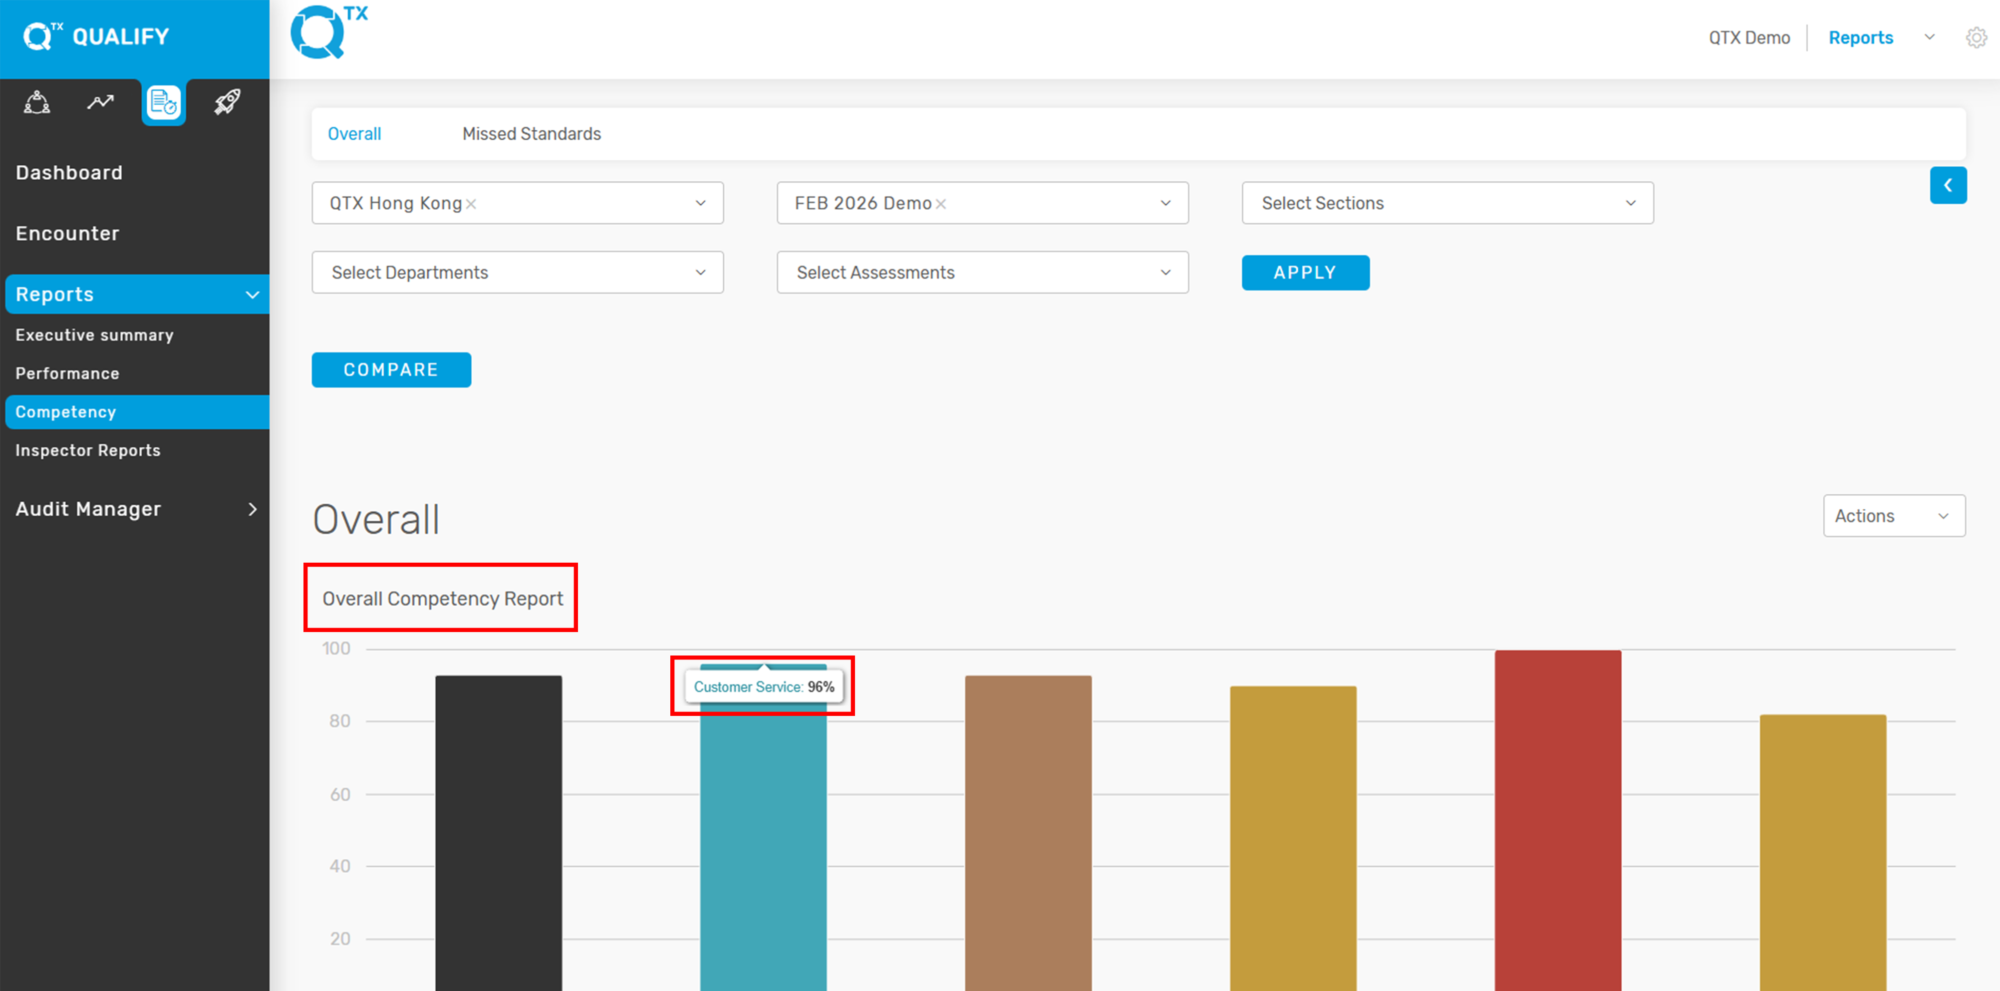
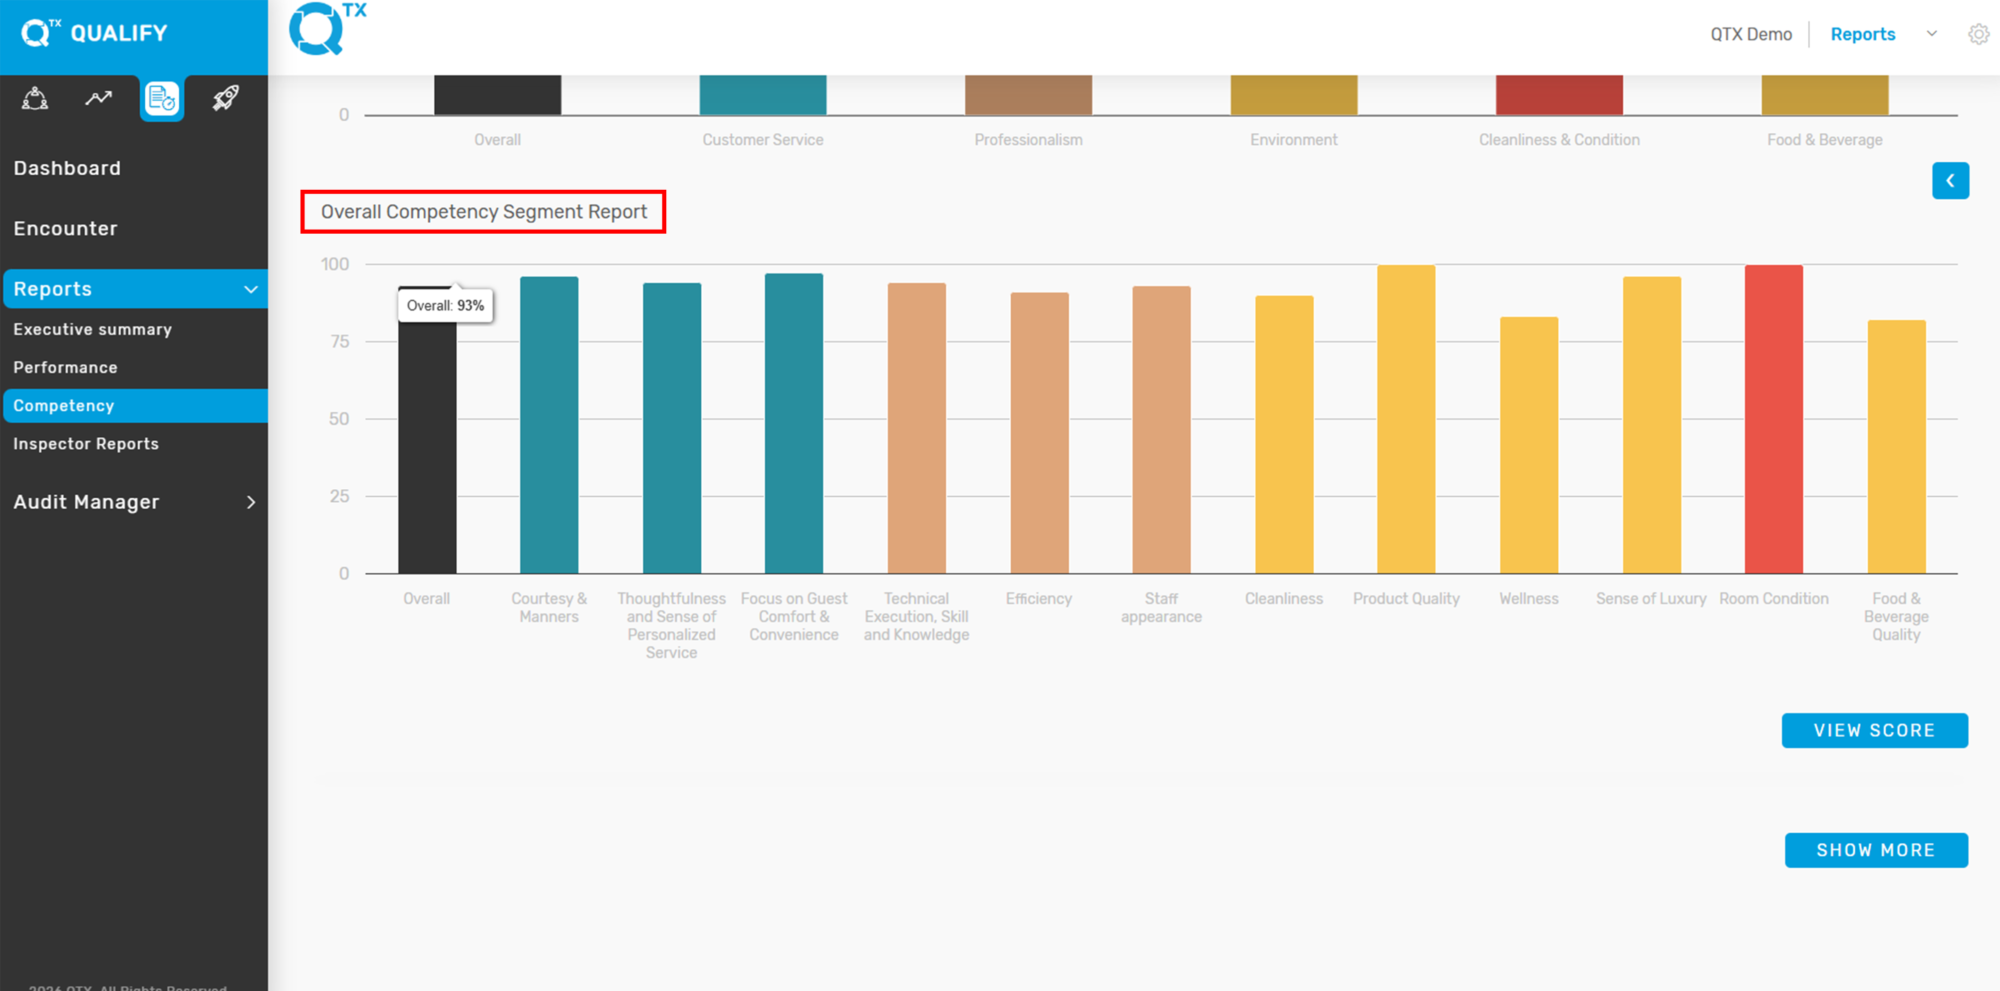
4. The Overall Competency Report will appear in a graphical format. Hover your cursor over each bar to view the corresponding percentage score.


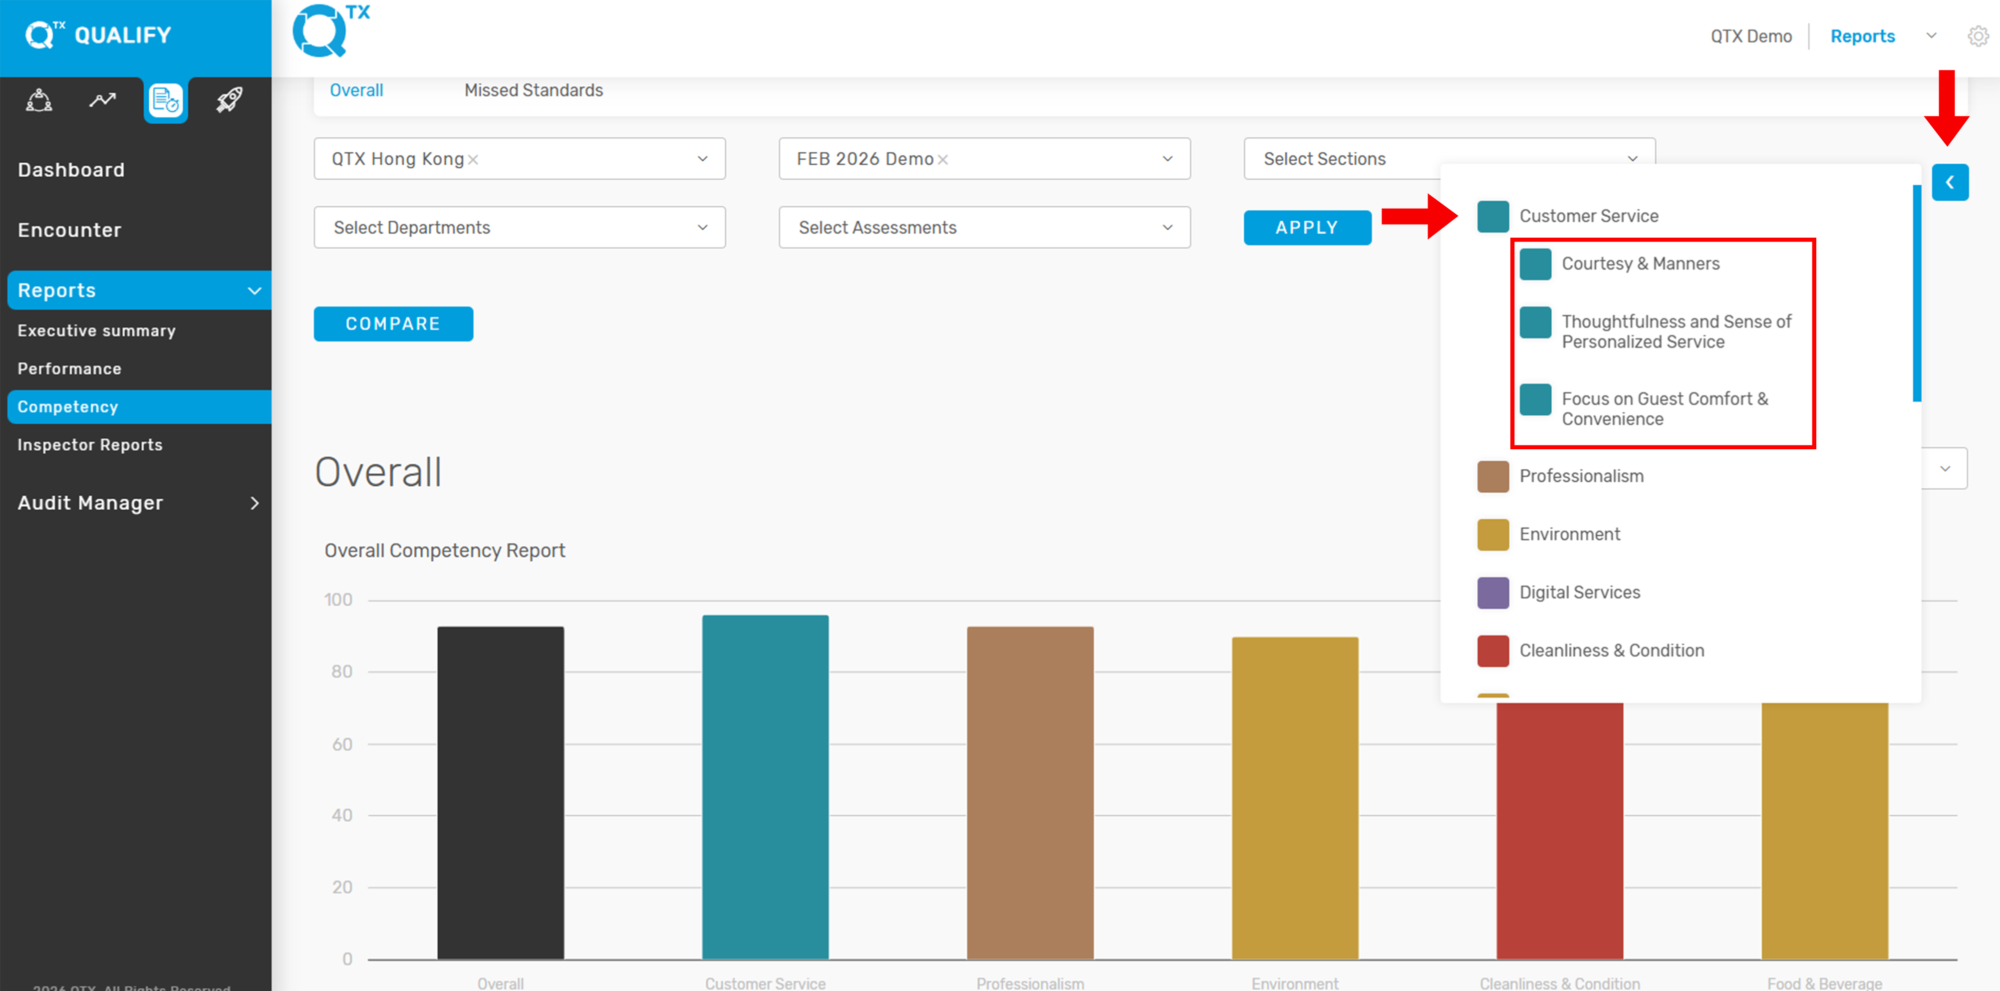
5. Click the “Arrow” button to expand or collapse the Competency list. Then, click the colored boxes to display the names of the Sub competency or Segment, if available.


6. Below is the Overall Competency Segment Report


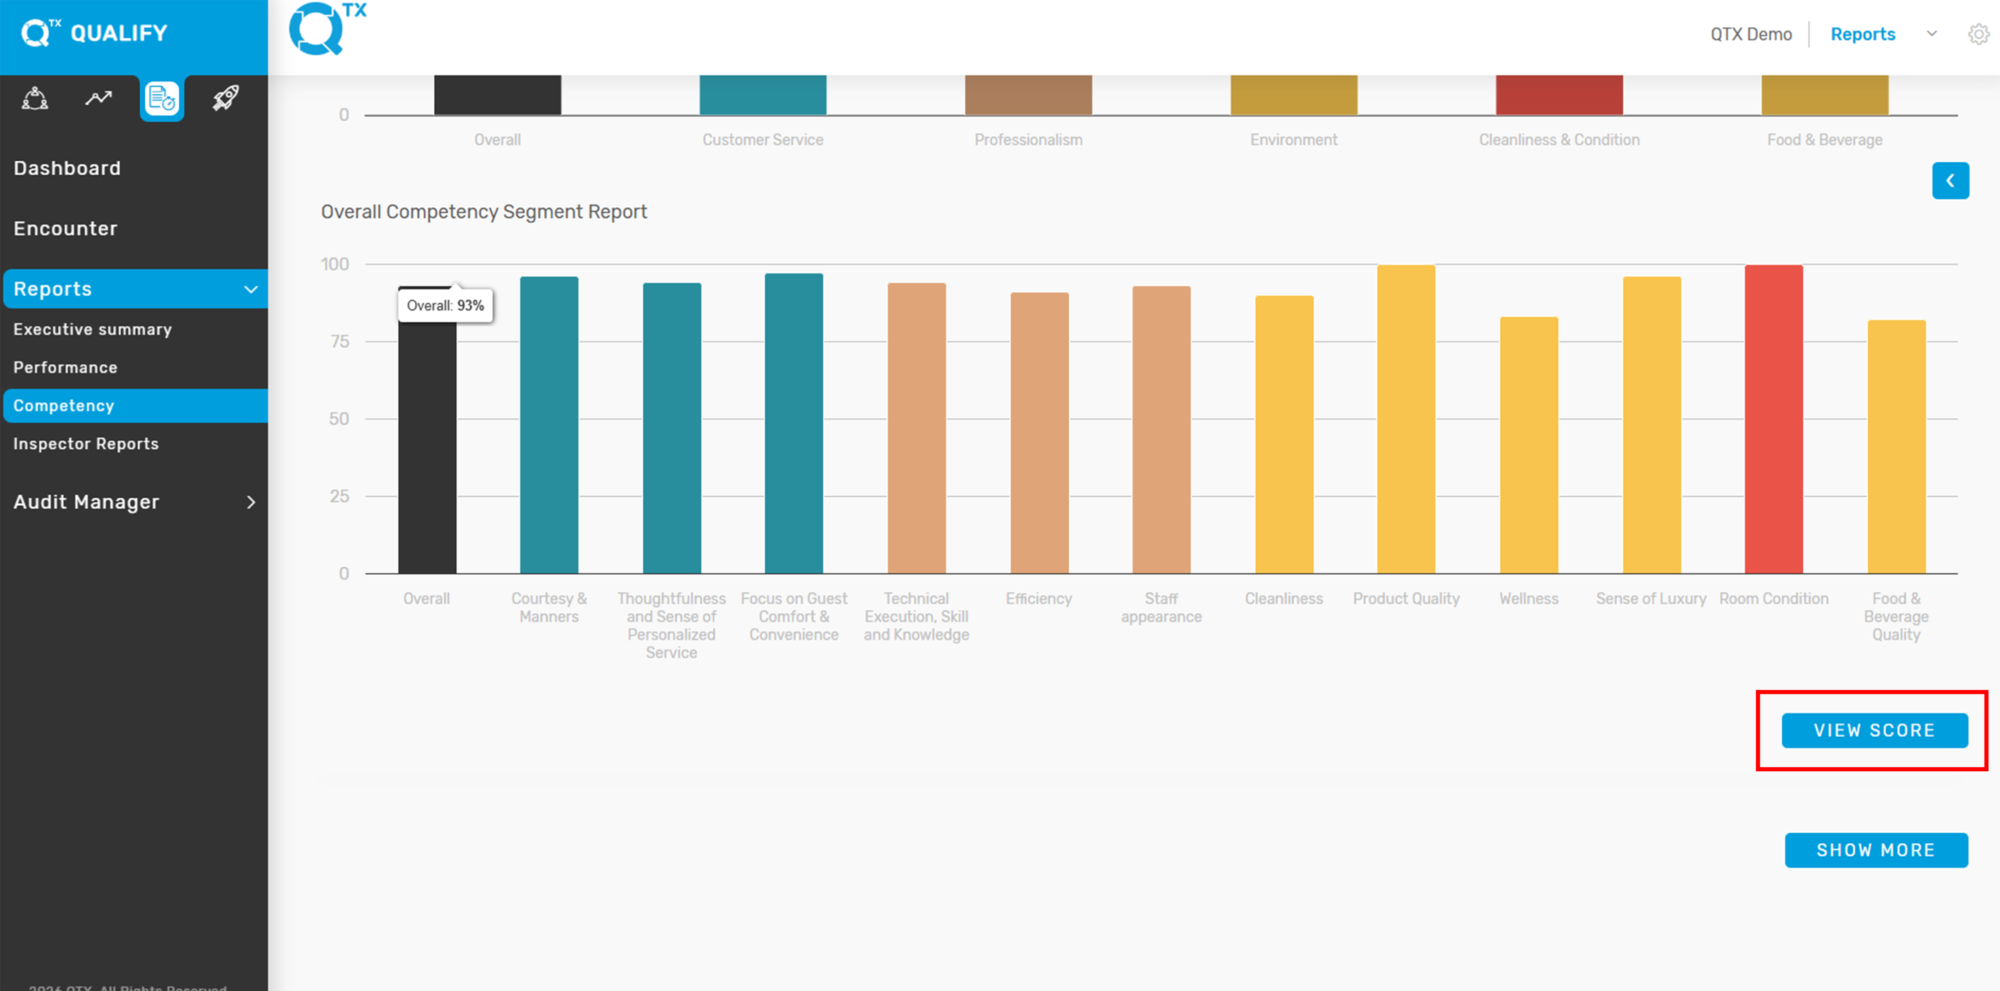
7. Click the “VIEW SCORE” button to see the scores.


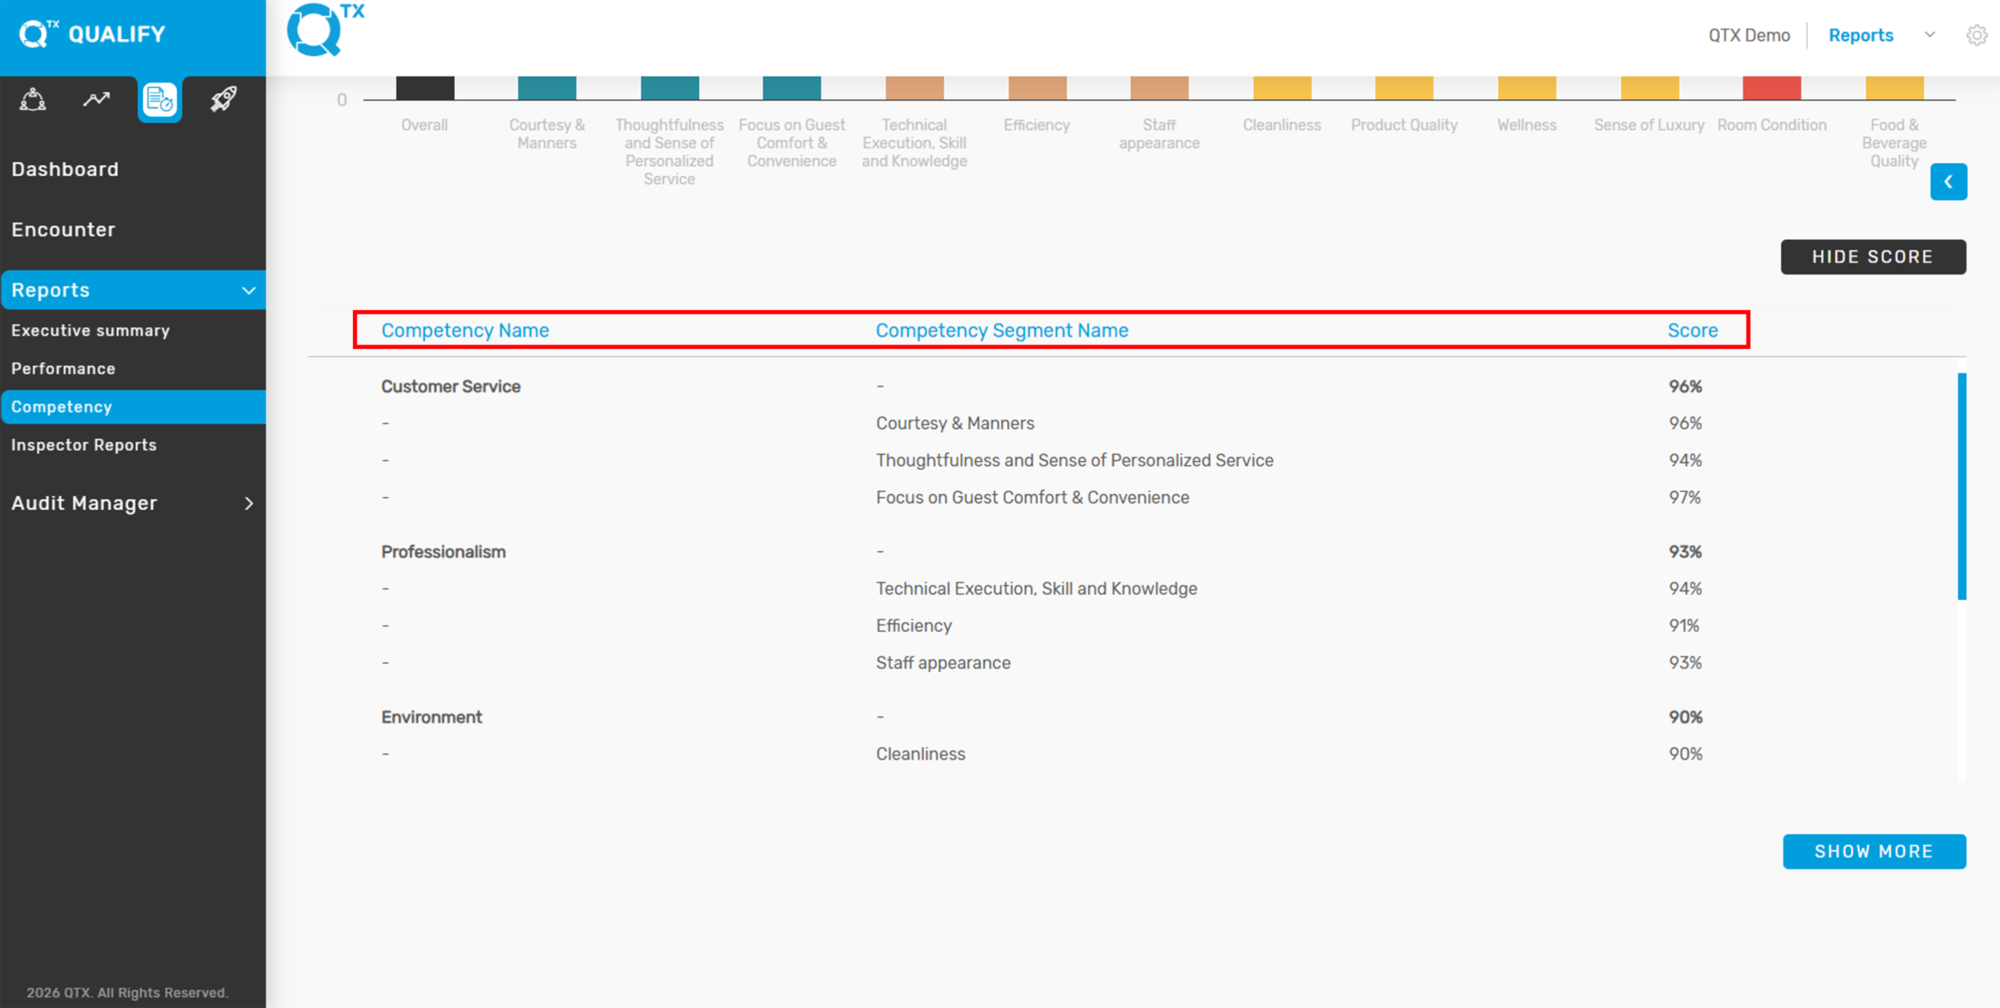
8. The data is categorized by Competency and its corresponding Competency Segment name.


9. Click “SHOW MORE” to view the Overall Competency and Overall Competency Segment reports categorized by Section.


If you need further assistance, please send an email to helpdesk@q-tx.com
Launch: How to View Number of Missed Standards Report in Performance

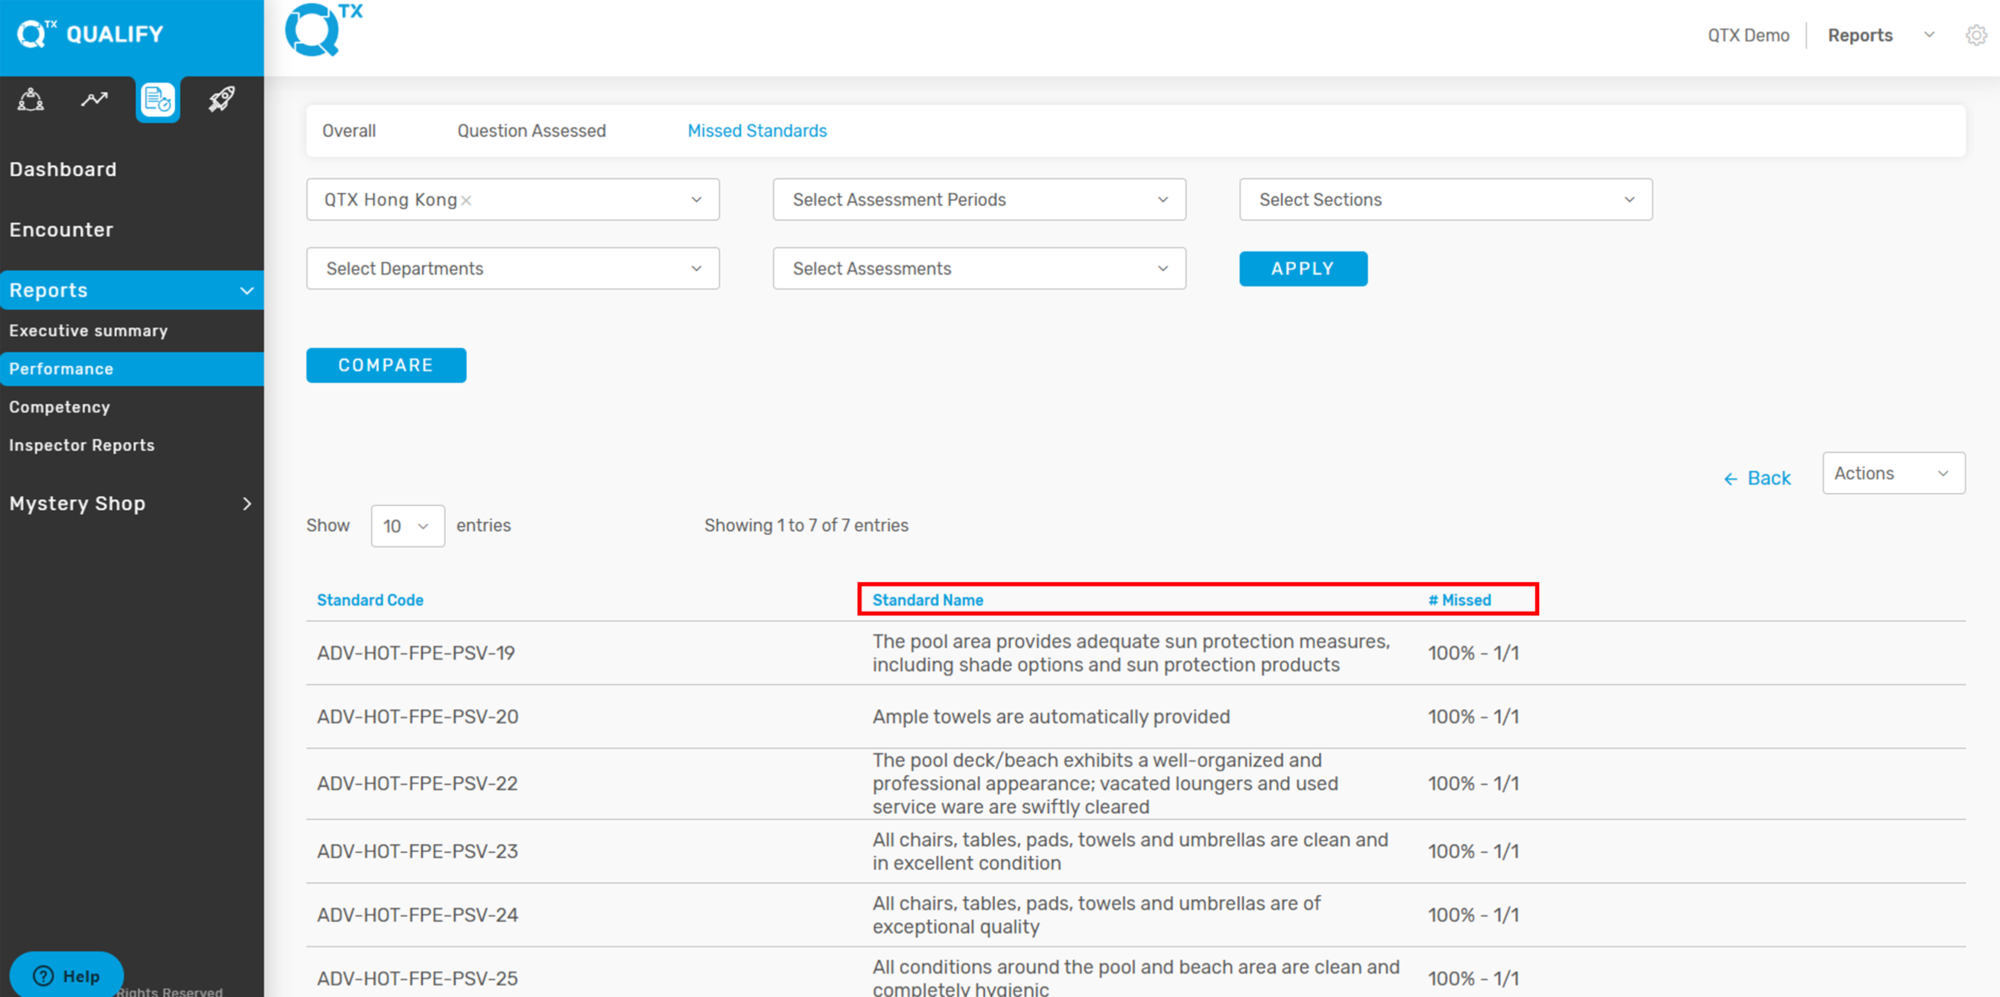
This displays the department and/or section’s missed standards, shown by number and percentage, based on each Assessment Name.


1. On the Dashboard landing page, click the “LAUNCH” button to proceed.


2. Click the “Reports” button, then select “Performance” from the dropdown menu.


3. Click the “Missed Standards” tab, then use the filters to select the relevant information.


4. The report will display missed standards by number and percentage, organized by Assessment Name.


If you need further assistance, please send an email to helpdesk@q-tx.com
Launch: How to View Summary of Questions Assessed

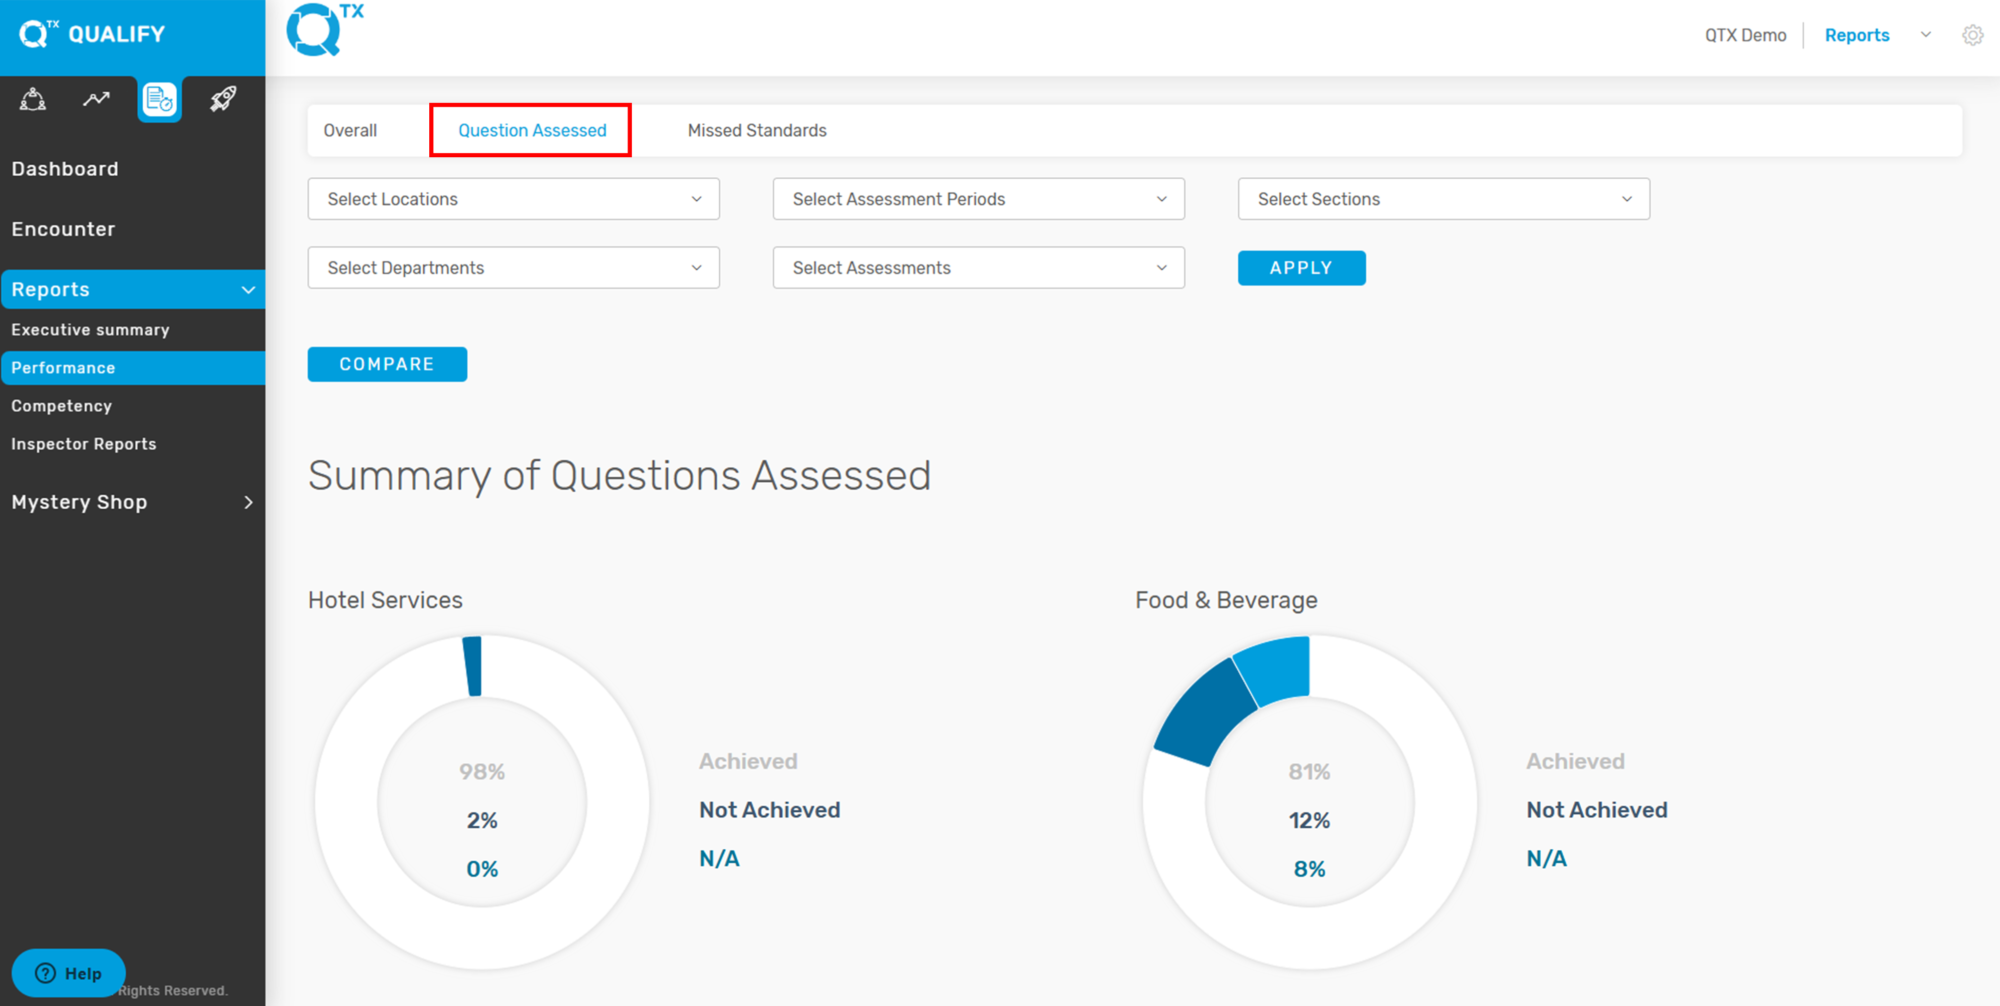
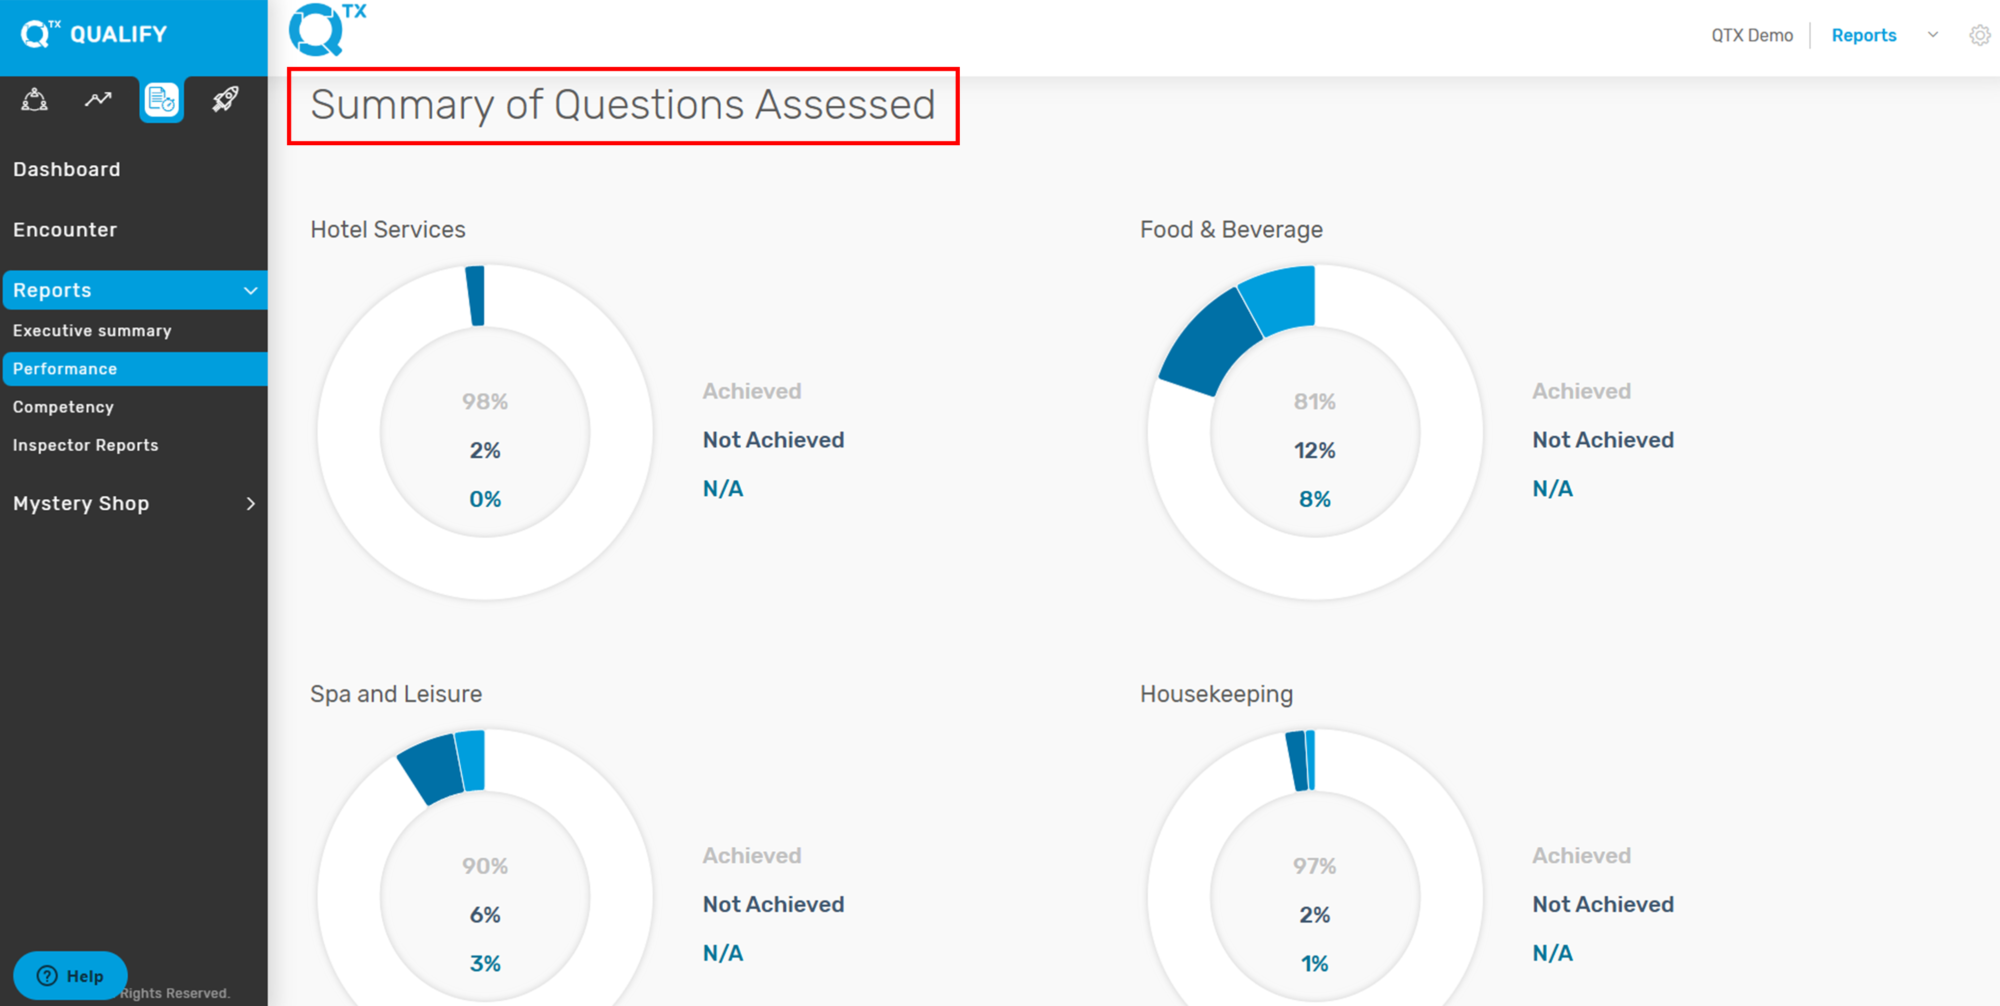
This section provides a summary score of questions that were either achieved or not achieved by the department. The percentage score is displayed in both pie chart and table formats for easy interpretation.


1. On the Dashboard landing page, click the “LAUNCH” button to proceed.


2. Click the “Reports” button, then select “Performance” from the dropdown menu.


3. Click the “Question Assessed” tab, then use the available filters to select the relevant information.


4. The summary of questions assessed by percentage will be displayed as a pie chart.


5. You can also view the Summary of Questions Assessed by percentage in a table format below the pie chart for easier comparison and analysis.


If you need further assistance, please send an email to helpdesk@q-tx.com
Launch: How to View the Overall Performance Report

The Performance Report enables management to recognize strengths by providing positive feedback and to identify areas that need improvement. Departments can use this information to discuss results collaboratively and develop action plans to enhance skills and overall performance.


1. On the Dashboard landing page, click the “LAUNCH” button to proceed.


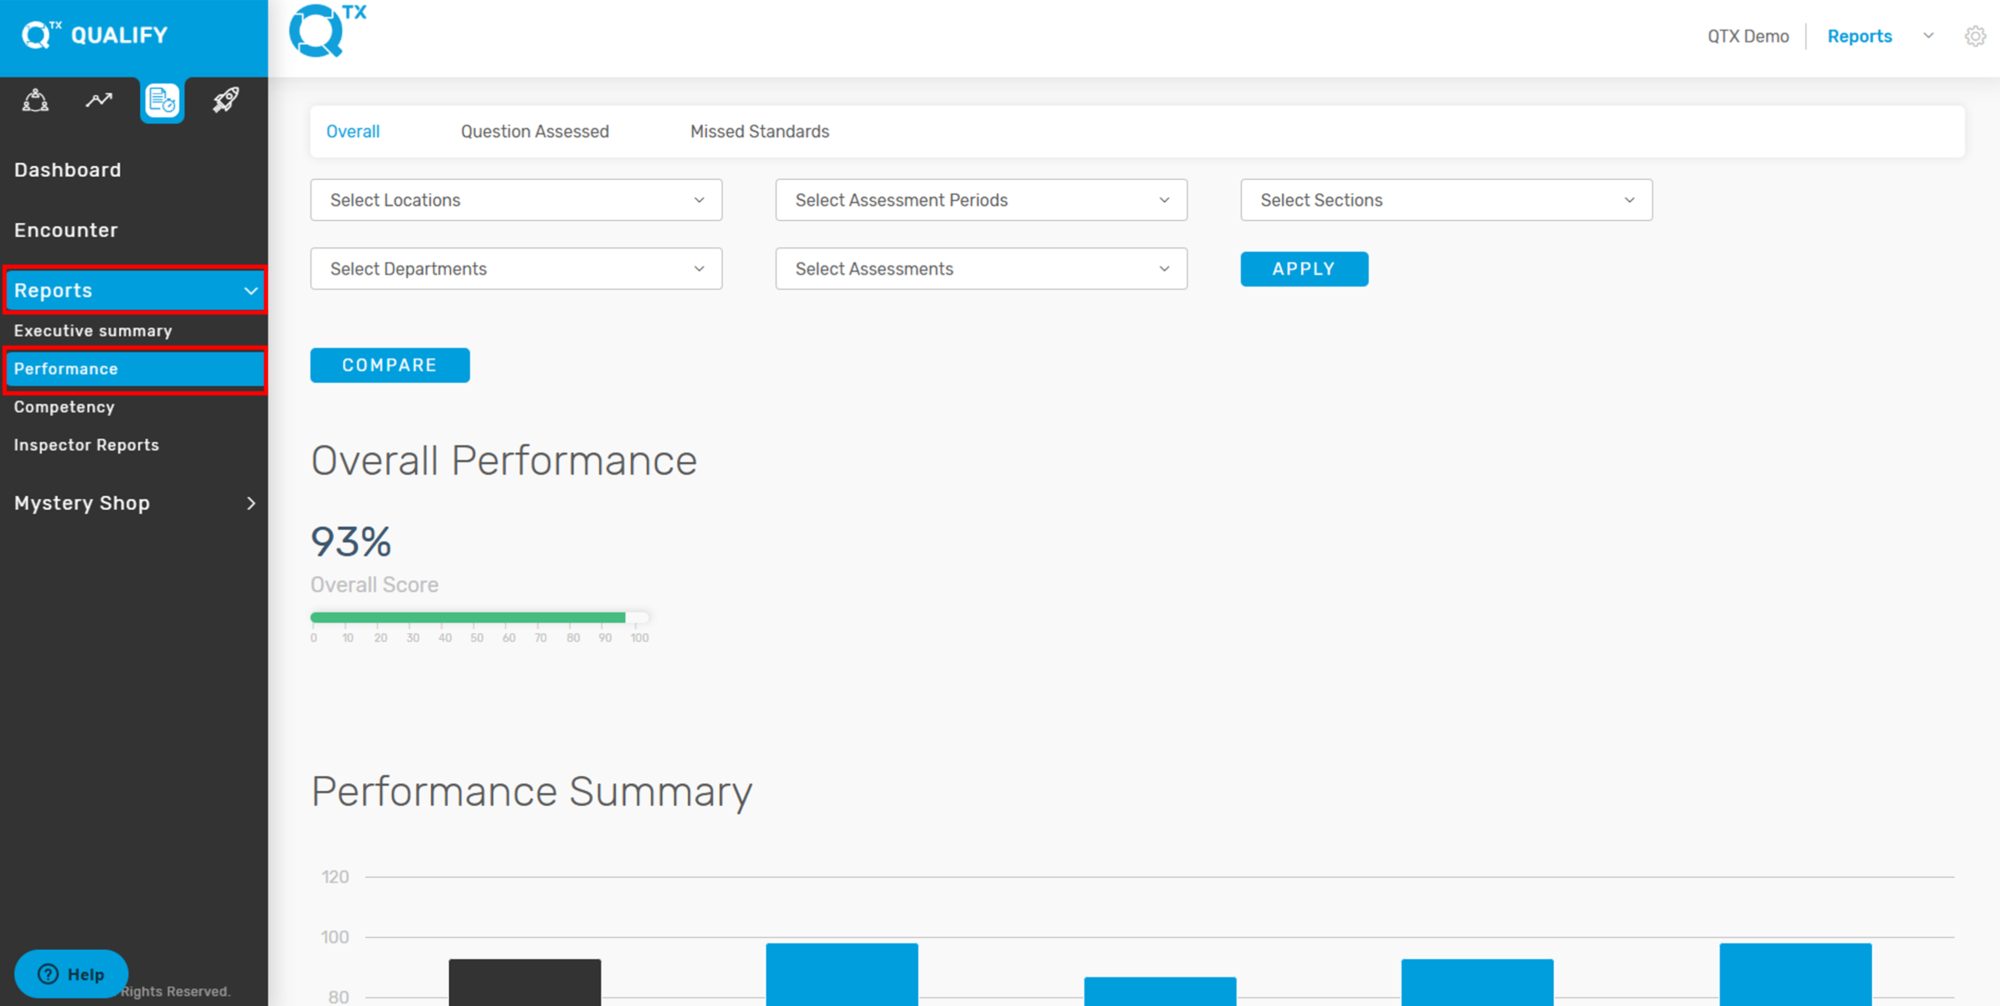
2. Click on the “Reports” button, then select “Performance” from the dropdown menu to access performance-related data and insights.


3. The system will automatically direct you to the “Overall” tab. From there, use the available filters to select the relevant information you want to view.


4. The Overall Performance score will be displayed as a percentage and visualized in a bar graph. Hover your cursor over each bar to view the exact score.


If you need further assistance, please send an email to helpdesk@q-tx.com

Launch: How to View the Overall Score of Assessment Period in Encounter

Viewing the Overall Score as a percentage helps users understand the department’s performance during a specific assessment period. The Inspector evaluates service delivery based on defined standard scales, providing a clear measure of achievement.


1.  On the Dashboard landing page, click the “LAUNCH” button to proceed.


2. Click the “Encounter” button, then use the available filters to select and refine the information you wish to view.


3. The Overall Score will be displayed as a percentage based on the selected Assessment Period.


If you need further assistance, please send an email to helpdesk@q-tx.com

Launch: How to View Dashboard Reports

This report helps track progress on standards and identify performance gaps. It provides high-quality feedback on internal guest experiences, which can be quickly transformed into relevant, meaningful, and actionable insights.


1. From the Dashboard, click the LAUNCH icon, then use the FILTERS function to fill out the required information.


2. On the same page, scroll down to view the reports. The Competency Report displays competency scores as percentages.


3. The Performance Summary presents scores by section in a graphical format, including the Overall Score. Hover your cursor over each bar to view the specific scores and the number of assessments.


4. This section displays two key insights: Most Frequently Missed and Most Achieved Standards, helping identify areas for improvement and strengths in service. Below, a performance table shows monthly and overall scores by department, making it easy to track progress and trends across time.


5. The Trending Chart displays sections plotted on a line graph. Hover over the data points to view the corresponding scores. You can check or uncheck different sections to customize the view based on your preferences.


If you need further assistance, please send an email to helpdesk@q-tx.com

Launch: How to View List of Available Locations as a Group User

As a Group User in QTX, you have access to multiple Locations — each representing a specific property or hotel where customized activities are conducted to assess service standards and enhance the overall guest experience. These locations reflect actual hotel operations and help users evaluate performance across departments.


1. On the Dashboard landing page, click the “LAUNCH” button.


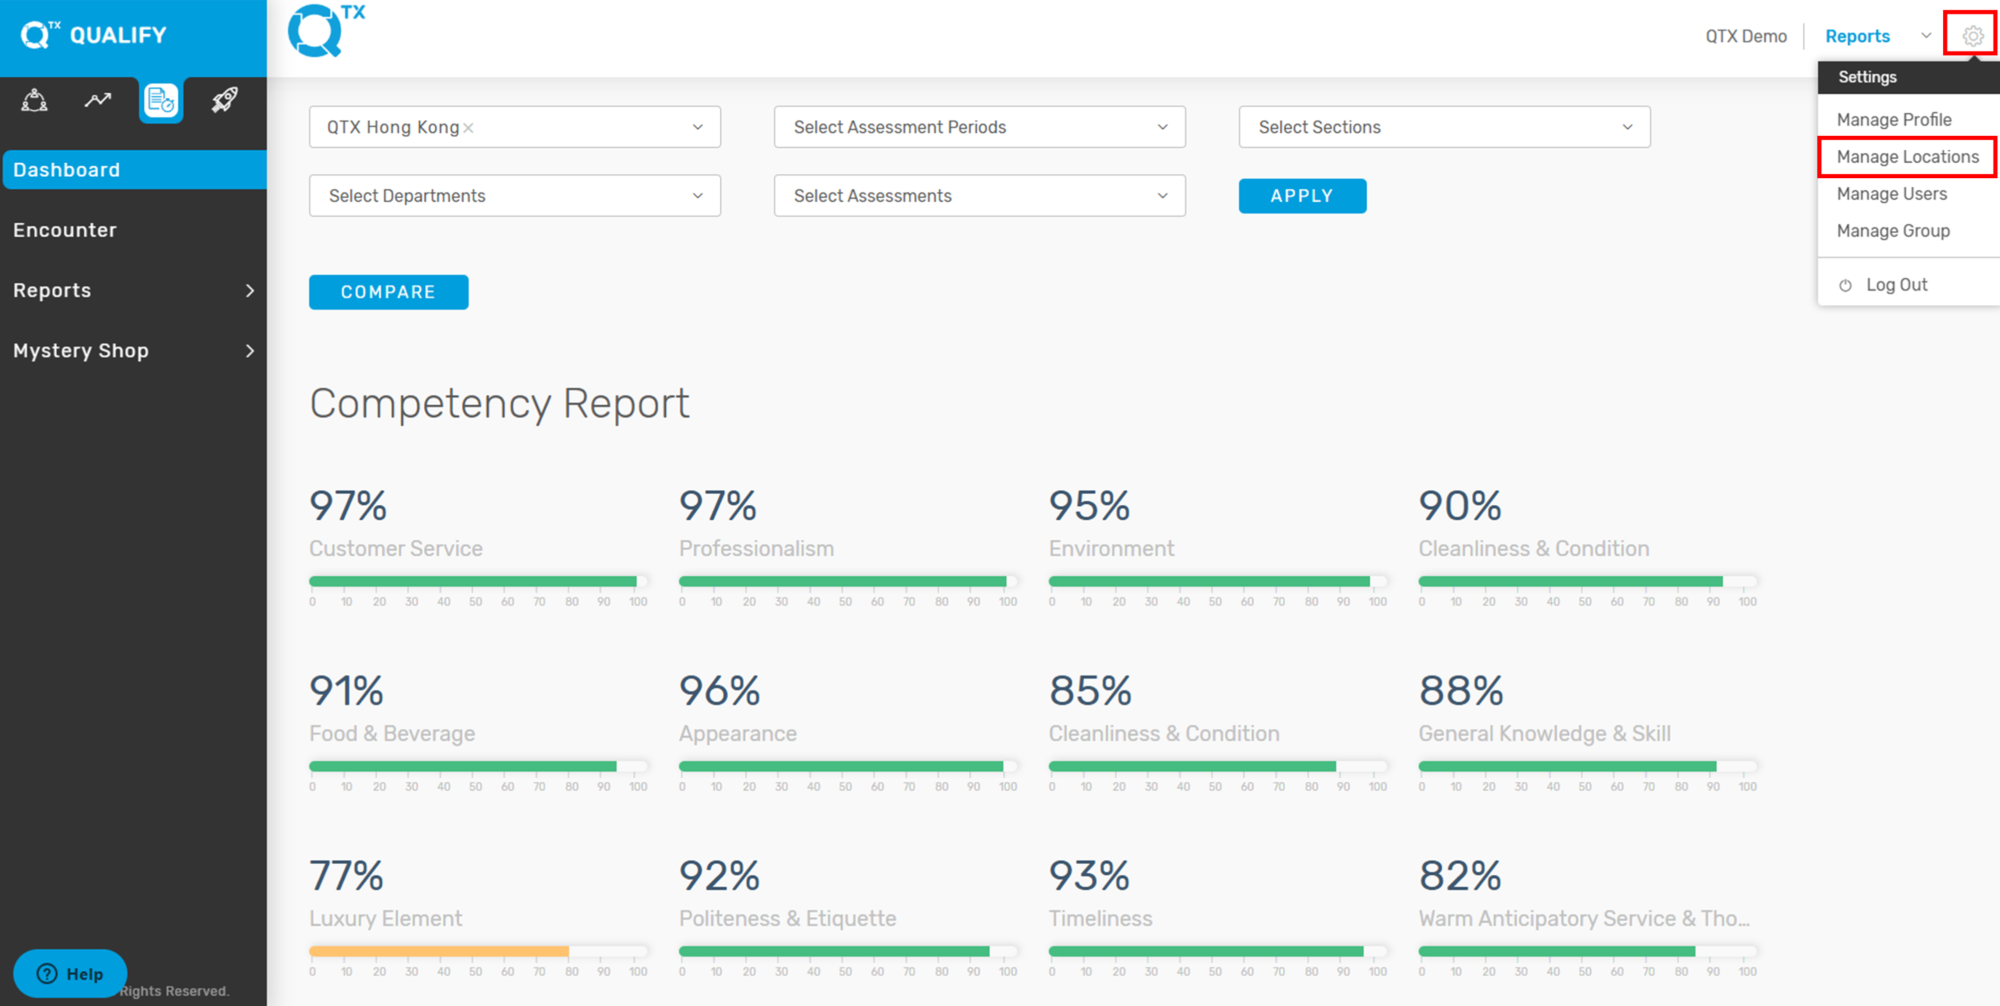
2. Click the Settings icon located in the top right corner of the screen, then select “Manage Locations” from the dropdown menu.


3. The system will automatically redirect you to the “Location” tab, where you can view, edit, or manage the list of properties assigned to your account.


4. The list of available Locations, along with their corresponding Sections and Departments, will be displayed on the screen as shown below. This allows you to easily view and manage the organizational structure of each property.


If you need further assistance, please send an email to helpdesk@q-tx.com

Launch: How to Find the Competency/Sub competency and Competency Code as a Group User

Each standard represents a specific category of the guest experience, referred to as a Competency or Sub-Competency. These classifications help organize and evaluate service performance based on key areas of hospitality and operational excellence.


1. On the Dashboard landing page, click the “LAUNCH” button.


2. Click the Settings icon in the top right corner of the screen, then select “Manage Locations” from the dropdown menu.


3. The system will direct you to the “Location” tab by default. From there, click on the “Competency” tab.


4. The system will display a list of Competencies along with their corresponding Sub-Competencies and assigned Codes.


5. You can change the language setting for competency details, if other language options are available. Additionally, you can upload data directly into the system using an Excel file, or view existing details by clicking on the number of entries shown.


If you need further assistance, please send an email to helpdesk@q-tx.com

Perform: How to View the Overall Score of Assessment Period in Encounter

Displaying the overall score as a percentage provides a clear measure of the department’s performance during a specific assessment period. The inspector evaluates service delivery based on established standards, allowing for an objective and consistent assessment of achievement.


1. From the Dashboard landing page, navigate to the PERFORM platform and select the “ENCOUNTER” tab to proceed.


2. Please ensure all required information is completed by using the available filters.


3. The Assessment Name and corresponding Overall Score will be displayed.


If you need further assistance, please send an email to helpdesk@q-tx.com

Perform: How to View List of Available Locations as a Group User

Within the Perform Platform Settings, you can view detailed information about each location. This includes the property name, abbreviation, and its corresponding city, state, and country. This is especially useful for verifying available properties and their setup.


1. From the Dashboard landing page, click on the PERFORM Platform tab.
Then, click the “SETTINGS” button located in the upper right corner of the screen.


2. Select “Manage Locations” from the settings menu.


3. You will be redirected to the Perform Platform Settings page.
Click on the “LOCATION” tab to continue.


4.Scroll down to view the list of available Locations.
Here, you’ll see each property’s name, abbreviation, and its assigned City, State, and Country.


If you need further assistance, please send an email to helpdesk@q-tx.com

Perform: How to View Inspector Reports

Inspector Reports are used to evaluate a range of hotel services and amenities, including room service, dining, and public areas like pools. These reports are based solely on visual inspections and reflect what the inspector directly observed.


1. From the Dashboard landing page, ensure you are on the PERFORM platform.
Click the “REPORTS – INSPECTOR REPORTS” tab.


2. Use the FILTERS provided to fill in all the necessary details, such as date range, location, and inspector name, to generate the correct report view.


3. Once filters are applied, a list of User Names (inspectors) will appear at the bottom of the page.


4. To view the Completed Assessment Ratio, simply click on an inspector’s name.
This will bring up details including:

List of Assessment Names
Completion Dates
Score Percentages
Department Names
Section Names
Location Names


5. To view the detailed Encounter Report, click on any “Room Inspection” listed under the assessment names.


6. Scroll down the report to view the Standard Names, Segments, and Inspector Commentary.
You’ll also have the option to View, Send, or Download any attached files.


If you need further assistance, please send an email to helpdesk@q-tx.com

Perform: How to View Competency Missed Standard Reports

This report highlights the number and percentage of missed standards categorized by Competency, helping teams identify common gaps and areas needing improvement.


1. From the Dashboard landing page, click on the “PERFORM” tab.


2. Click the “Reports” button, then select “Competency” from the dropdown menu.


3. Make sure you are on the “MISSED STANDARDS” tab.


4. The report will display a breakdown of missed standards by number and percentage, organized by each Competency.


If you need further assistance, please send an email to helpdesk@q-tx.com

Perform: How to View Assigned Assessment as a Group User

An assessment consists of one or more questions, activities, or actions within an assignment that can be scored. A category groups together similar assessment types and can be weighted to impact the overall course or performance score.


1. From the Dashboard landing page.


2. Ensure you are in the “PERFORM” platform.
Then click on the “ASSESSMENTS – ASSIGNMENTS” tab.


3. Use the FILTERS at the top of the page to enter all required information — such as date range, department, location, or user — to refine your search results.


4. Scroll down the page to view the list of Assessment Names associated with the filtered criteria.


If you need further assistance, please send an email to helpdesk@q-tx.com

Perform: How to Find/View the Competency as a Group User

Competencies help define the skills or tasks a person needs to perform well in their job. Each one includes detailed behaviors that show different levels of proficiency.


1. From the Dashboard, go to the PERFORM Platform. Click the “SETTINGS” button at the top right of the screen.


2. Choose “Manage Locations” from the menu.


3. You will be taken to the Connect Platform Settings page. Click the “COMPETENCY” tab.


4. Scroll down to see the list of Competencies, Sub – competencies, and their Codes.


If you need further assistance, please send an email to helpdesk@q-tx.com

Perform: How to Customize Assessments as a Group User

This platform offers advanced “Customize Assessment” capabilities, enabling users to efficiently add or update assessment questions to align with dynamic requirements.


1. From the Dashboard landing page, make sure you’re in the PERFORM platform. Then click on “ASSESSMENTS – BUILDER.”


2. The highlighted section displays essential details for each assessment, including the Assessment Code, Assessment Name, Department Name, Section Name, a QR code download link, and the Last Update timestamp. This allows users to easily identify and manage assessment records.
To view an assessment’s details, select its Assessment Code from the list.


3. The image displays a “Customize Assessment” page within a system, likely for managing performance or training. Key areas highlighted by red boxes include the “Check-in” section and “Assessment Instructions.” Users can edit instructions, such as “go to front desk,” and also edit the “Check-in” assessment name.


4. Highlight several features on the “Customize Assessment” page. The top left red box indicates a multi-step process, with numbers 1 through 7 likely representing the number of assessment sections or questions that need to be answered. A red box further down outlines an area to “Drag and drop or click to upload file,” with a note that only image, audio, and video files (up to 10MB) are allowed. Finally, a red arrow points to a checkbox labeled “Enable Employee Recognition,” indicating an optional feature for the assessment.


5. The “Assessment Attributes” where users can define custom fields for an assessment. Two primary attributes, “Team Member Name” and “Shift / Period,” are shown with their respective options. Red arrows indicate these attribute sections, and a red box highlights the “Select Attribute” dropdown menu at the bottom, which allows users to add more attributes like “Room Number,” “MOD Name,” “Hotel Occupancy,” and others from a predefined list.


6. A red arrow points to the “Require comment for” field, which has a dropdown menu highlighted by a red box. This dropdown allows users to select whether comments are “N/A,” “NO,” or “YES” for specific answers within the assessment. This feature enables control over when an assessor must provide additional textual feedback.


7. The primary questions are referred to as “Standard” (e.g., “Did the staff greet you…”). Red arrows highlight fields for “Placeholder” and “Question Guide,” which provide additional context. Below these, “Test1” and “Test 1” represent the “Competency” and “Sub Competency” respectively. A “1” indicates the “Weightage,” and “Test2” represents the “Category.”


8. On the lower page, you’ll have the option to click “ADD QUESTION” to include a new question in the assessment.


If you need further assistance, please send an email to helpdesk@q-tx.com

Perform: How to Assign an Assessments to Inspector as a Group User

An assessment consists of one or more questions, tasks, or actions that an individual can be scored on. A category is a group of assessment types that can be assigned a percentage or weight toward the overall course score.

Here’s how to assign an assessment in the PERFORM platform:


1. From the Dashboard landing page, make sure you’re in the PERFORM platform.


2. Then click on the “ASSESSMENTS – ASSIGNMENTS” tab.


2. Click the “ASSIGN ASSESSMENT” button.


3. Fill in all the required information such as location, department, section, assessment name, and user details.


4. Once everything is complete, click the “ASSIGN” button to finalize the process.


If you need further assistance, please send an email to helpdesk@q-tx.com

Qualify: How to Customize Assessments as a Group User

An assessment is a type of questionnaire used to evaluate the quality or nature of a product or person. It plays an important role as these questionnaires serve as the main standard service of each section.


1. On the Dashboard landing page, click the “QUALIFY” button to proceed.


2. Click the “Audit Manager” button, then select “Assessment Builder”. From there, choose the relevant information from the selection lists to apply the appropriate filters for your assessment setup.


3. Click on any Assessment listed to view its details.


4. Let us take Arrival Service as an example to view how the assessment is displayed.


5. Below is the Arrival Service Assessment, which outlines the related Competency (Customer Service) and Subcompetency (Courtesy & Manners). Each Standard within the assessment is rated on a scale from 1 to 3. Additionally, if needed, you can deactivate a specific standard by toggling the blue icon indicated by the arrow.


6. To complete the question setup in the QTX Builder, make sure to fill in the fields indicated by the red arrows and box. Enter a placeholder (brief instruction or sample response) and a question guide (detailed explanation or criteria). Then, from the dropdown marked with the red box, select the appropriate category that aligns with the question content. These fields help organize and guide the assessment effectively. If a new question needs to be inserted—changing the current order of questions—the user must submit a new set of assessments. Our team will handle the updates to ensure that the historical data of previous assessments remains intact.


If you need further assistance, please send an email to helpdesk@q-tx.com

Qualify: How to View Mystery Shop as a Group User

This report is important because it allows users to directly access the Inspector’s feedback and experience. It also enables Group Users to monitor the status of assigned assessments, indicating whether they have been started or completed.


1. On the Dashboard landing page, click the “QUALIFY” button to proceed.


2. Click the “Audit Manager” button, then select “Assign & Review Audits.” After that, choose the appropriate Assessment Period to view the related assignments.


3. In the Assign & Review Audits section, each assessment is displayed in a table format. The columns highlighted in the red boxes show the Status (e.g., Completed) and the Change Status toggle.


4. If the Action toggle is blue, it means the assessment is currently inactive and visible to the Encounter Report.


5. To edit a completed Encounter Report, simply find the report you want on the list, then click the blue In REVIEW button on the right side. This will open the report where you can make your edits.


6. You will notice the Standards in Review button. Click it to view the Encounter Report.


7. The Assessment Report will be displayed. Click “VIEW BY COMPETENCY” to see the full details categorized by competency at the bottom of the report.


8. Below is a sample of an Assessment. In the “Attached Files” section, you can view any supporting attachments such as images or documents, if available.


9. To delete an assessment, simply check the small box next to the assessment you want to remove, then click the “DELETE” button to confirm the action.


If you need further assistance, please send an email to helpdesk@q-tx.com

Qualify: How to View Number of Missed Standards Report by Competency

This displays the total number and percentage of missed standards, categorized by Competency, helping to identify areas needing improvement.


1. On the Dashboard landing page, click the “QUALIFY” button to proceed.


2. Click the “Reports” button from the navigation menu, then select “Competency” to view performance data.


3. Click on the “Missed Standards” tab, then select the relevant filters from the available options. From here, you will be able to see the number of Missed Standards based on the selected criteria.


4. The report will display the missed standards categorized by Competency, showing both the number of missed items and their corresponding percentage. This helps identify specific areas needing improvement.


5. Click any of the Competency Names to display a detailed list of the missed standards under that specific competency, as shown in the example below. This allows users to pinpoint which standards were not met.


If you need further assistance, please send an email to helpdesk@q-tx.com

Qualify: How to View Overall Competency Report

Each standard reflects a category of inspector feedback/experience, known as a Competency and Subcompetency/Segment. This report presents the details of the Competency Report by location, section, and department. Classifying the information accordingly will make it easier for the user to understand overall performance.


1. On the Dashboard landing page, click the “QUALIFY” button to proceed.


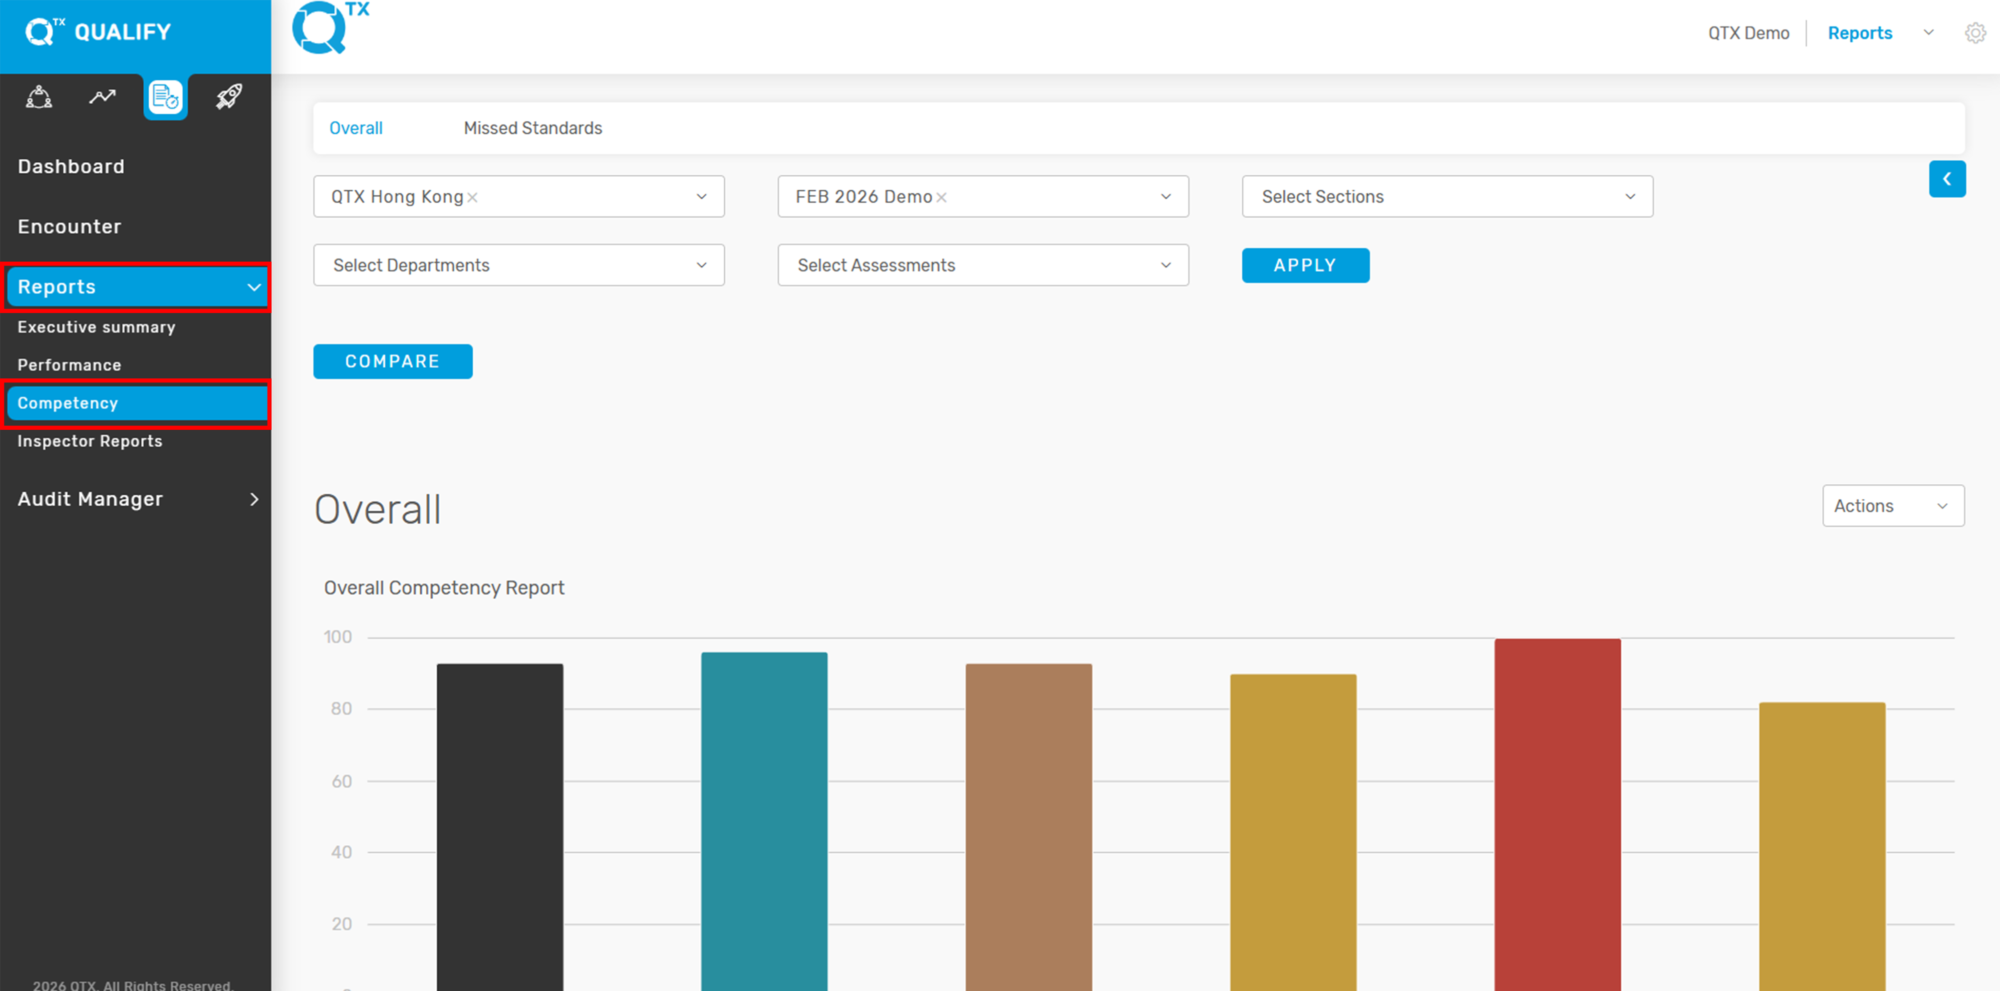
2. To access the Competency Report, start by clicking the “Reports” button located on the main navigation menu. From the dropdown options that appear, select “Competency” to view the detailed report related to inspector feedback and performance metrics.


3. Ensure that you are on the “Overall” tab before proceeding. From there, use the selection list to filter and choose the relevant information you wish to view, and clickthe  “Apply” button.


4. The Overall Competency Report will be displayed as a graph. To view the percentage score for each category, simply point your cursor at the specific graph bars.


5. Click the “Arrow” button to show or hide the Competency list. Then, click on the colored box items within the list to view the corresponding Subcompetency or Segment name, if available.


6. Below is the Overall Competency Segment Report, which provides a breakdown of performance across various segments.


7. Click the “VIEW SCORE” button to display the scores categorized by Competency and Competency Segment Name.


8. From here, you can view the Competency Name, Competency Segment Name, and their corresponding scores.


If you need further assistance, please send an email to helpdesk@q-tx.com

Qualify: How to View Number of Missed Standards Report in Performance

This displays the number and percentage of missed standards for a department and/or section, based on the selected Assessment Name.


1. On the Dashboard landing page, click the “QUALIFY” button to proceed.


2. Click the “Reports” button, then select “Performance” from the dropdown menu to proceed.


3. Click the “Missed Standards” tab to access the relevant section. Then, use the selection list to filter and choose the specific information you want to view. And click the “Apply” button.


4. The report will display the total of missed standards by number and percentage, based on the selected Assessment Name.


5. Click on any Assessment Name, and the list of missed standards per standard will be displayed as shown below.


If you need further assistance, please send an email to helpdesk@q-tx.com

Qualify: How to View Summary of Questions Assessed

This displays a summary of the questions that have been achieved and not achieved by the department. The percentage score is presented in both pie chart and table formats.


1. On the Dashboard landing page, click the “QUALIFY” button to proceed.


2. Click on the “Reports” button, then select “Performance”.


3. Click the “Question Assessed” Tab. Then, use the selection list to filter and choose the specific information you want to view.


4. The system will display a summary of the assessed questions as a percentage, shown in a pie chart.


5. This table helps provide a clear overview of how each department performed in its assessments. By showing the percentage of Achieved, Not Achieved, and N/A responses, it allows users to quickly identify strengths and areas for improvement.

The N/A (Not Applicable) score is important because it indicates questions that were not relevant to the specific department or situation. These are excluded from the final performance calculation to ensure the score accurately reflects only the applicable criteria. This prevents departments from being unfairly scored on items outside their scope of responsibility.


If you need further assistance, please send an email to helpdesk@q-tx.com

Qualify: How to View the Overall Performance Report

The Performance Report enables management to provide positive feedback and identify areas for improvement. It also allows departments to review results collaboratively and develop action plans to enhance skills and performance.


1. On the Dashboard landing page, click the “QUALIFY” button to proceed.


2. Click on the “Reports” button, then select “Performance”.


3. The system will redirect you to the ‘Overall’ tab. From there, select the relevant information from the dropdown list to apply filters.


4. The Overall Performance score is displayed as a percentage and shown in a graph format. Hover your cursor over a bar in the graph to view the exact Overall score.


If you need further assistance, please send an email to helpdesk@q-tx.com
Qualify: How to View the Overall Score of Assessment Period in Encounter

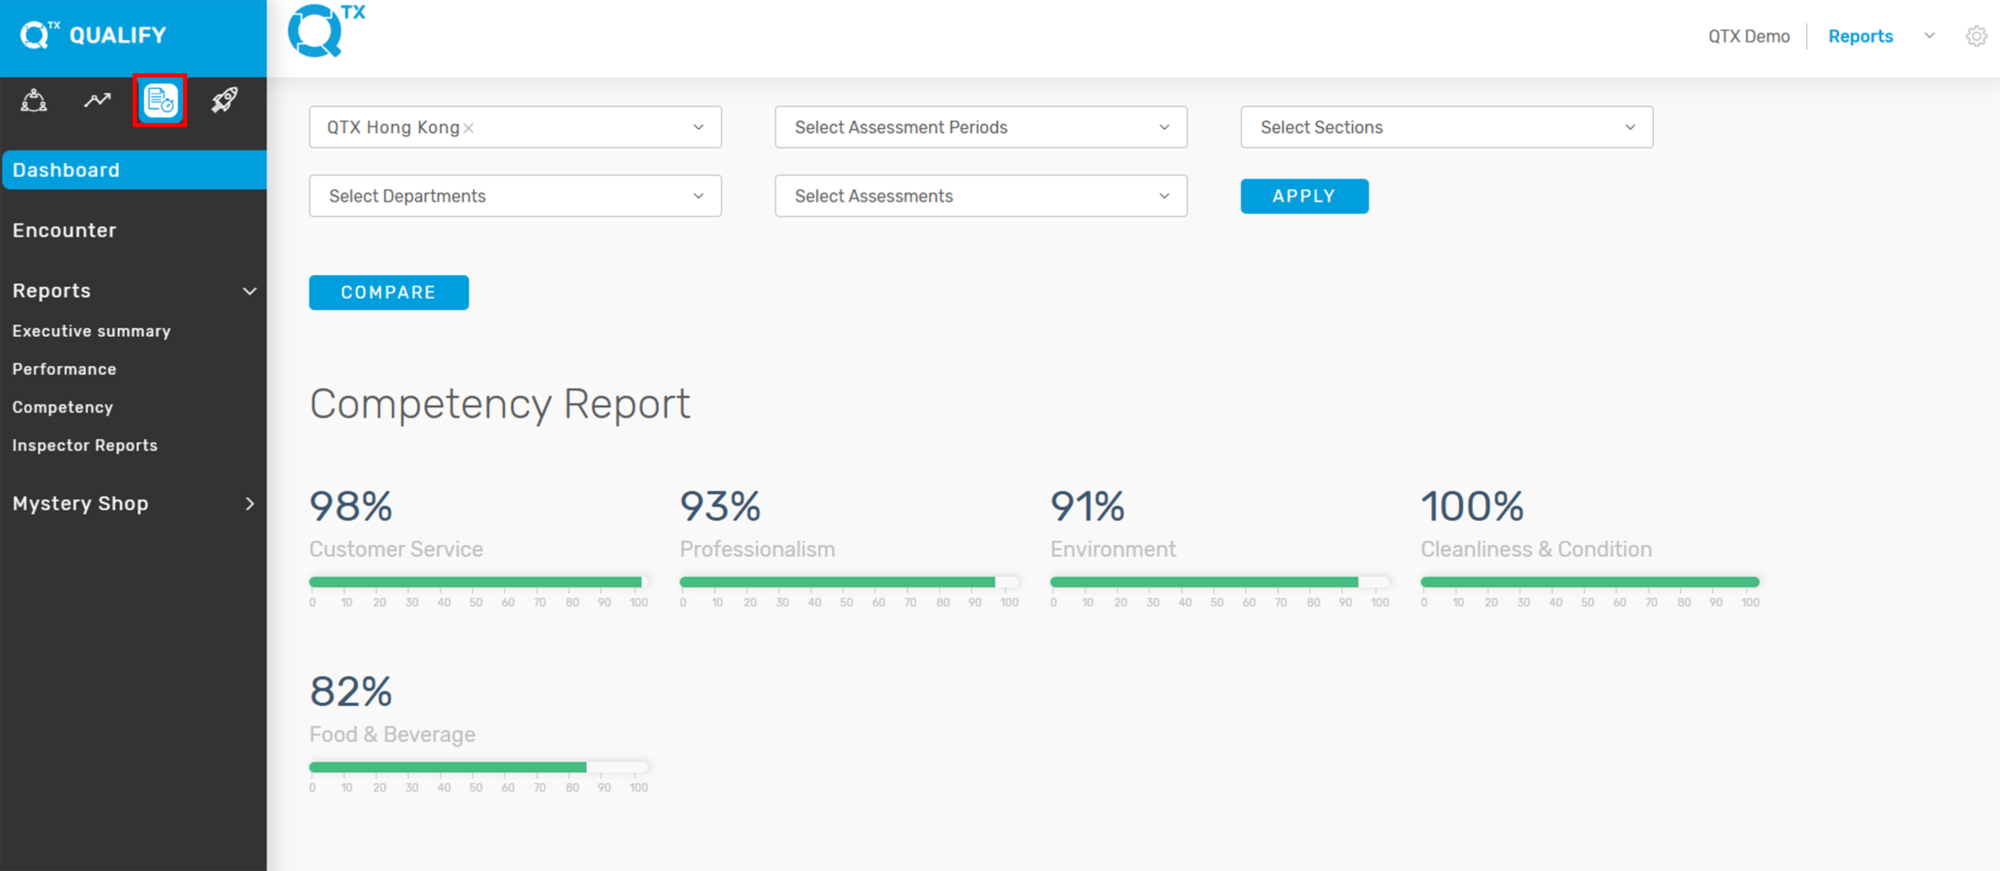
Displaying the Overall Score as a percentage helps determine the department’s achievements during a specific assessment period. The inspector evaluates the department’s service performance based on standardized rating scales.


1. On the Dashboard landing page, click the “QUALIFY” button to proceed.


2. Click the ‘Encounter’ button, then select the relevant information and click the ‘Apply’ button to filter.


3. The Overall Score is displayed as a percentage based on the selected assessment period.


If you need further assistance, please send an email to helpdesk@q-tx.com

Qualify: How to View List of Available Locations as a Group User

Location refers to the specific property or hotel where the tailor-made mystery shopping assessment takes place. This is the physical site selected to evaluate how well the service delivery aligns with brand standards and expectations. Each location is assessed individually to ensure the accuracy and relevance of the findings, helping management understand performance at the property level and identify opportunities for improvement.


1. On the Dashboard landing page, click the “QUALIFY” button to proceed.


2. Click the settings icon in the top-right corner, then select ‘Manage Locations’.


3. The system will navigate to the ‘Location’ tab, where a list of Locations, Sections, and Departments will be displayed as shown below.


If you need further assistance, please send an email to helpdesk@q-tx.com

Qualify: How to Find the Competency/Subcompetency and Competency Code as a Group User

Each standard represents a specific category of the guest experience, referred to as a Competency or Subcompetency. These categories help organize the evaluation criteria into meaningful segments. By grouping standards under competencies, the assessment provides a structured view of performance, making it easier to identify strengths and areas for improvement within each aspect of the guest journey.


1. On the Dashboard landing page, click the “QUALIFY” button to proceed.


2. Click the settings icon in the top-right corner, then select ‘Manage Locations’.


3. Click the ‘Competency’ tab to view the list of Competencies along with their corresponding Subcompetencies and Codes.


4. You can change the language setting of the competency details, if another language is available. Additionally, you can upload data from an Excel file and view the total number of entries.


If you need further assistance, please send an email to helpdesk@q-tx.com

Connect: How to Choose to Show the Number of Decimal Points in Reports

This setting allows users to define the number of decimal points displayed in reports. Adjusting the decimal precision ensures numerical data is presented with the required accuracy, whether rounded for simplicity or shown in full detail for analytical purposes.


1. On the Dashboard landing page, click the “SETTINGS” button located in the upper-right corner.


2. Then, choose “Manage Profile” from the drop-down menu.


3. Here, you will see the account owner’s profile details along with the option to change the password.


4. At the bottom of the page, you can configure how numbers are displayed in the reports (e.g., number of decimal points) and also change the language.


If you need further assistance, please send an email to helpdesk@q-tx.com

Connect: How to Find / View the Key metrics as a Group User

Key Performance Indicators (KPIs) are essential metrics for a business. They provide measurable statistics that reflect the performance of an organization or department. All organizations, from nonprofits to multinational corporations, need to track these metrics to gain an accurate picture of their operations. By reviewing key metrics, organizations can obtain insights that would otherwise require a complex analysis of large amounts of data.


1. On the Dashboard landing page, click the “SETTINGS” button located in the upper-right corner.


2. Then, choose “Manage Locations” from the drop-down menu.


3. The system will take you to the default view. Click on the “KEY METRICS” tab. From here, you can add new key metrics based on the aligned business requirements.


If you need further assistance, please send an email to helpdesk@q-tx.com

Connect: How to View Monthly Report

The Monthly Report compiles feedback and insights from guest experiences at the hotel. It serves as a key tool in evaluating service standards, identifying trends, and ensuring consistency in the quality of hospitality provided to guests. This report supports continuous improvement by highlighting strengths and addressing areas that require attention.


1. On the Dashboard landing page, ensure you are in the Connect Platform. Then, click on REPORTS – MONTHLY REPORT. Use the FILTER option to fill in and complete all the required information.


After applying the filter, scroll down to view the Overall Satisfaction, Global Score, and Response Rates.


List of Key Metrics, including the Number of Responses


The Top 5 Areas represent the departments or outlets with the highest satisfaction rates, while the Bottom 5 Areas represent those with the lowest satisfaction rates.


2. Here, you can view the data related to Problem Resolution.


Guest Demographics refers to the statistical characteristics of hotel guests, such as age, gender, nationality, place of origin, purpose of stay (business or leisure), and other background information. These details help the hotel understand its guest profile, identify trends, and tailor services to meet guest needs more effectively.


This data shows the Commentary Statistics Report for each department or outlet, along with the total number of comments.


If you need further assistance, please send an email to helpdesk@q-tx.com

Connect: How to View Survey Templates

On this platform, you can view the list of available survey templates, including After Stay Surveys, General Surveys, and Outlet Surveys. These templates are designed to gather valuable feedback from guests at different touchpoints of their experience. The After Stay Survey helps capture insights on overall satisfaction after a guest’s visit, the General Survey provides feedback on broad service areas, and the Outlet Survey focuses on specific departments or facilities such as restaurants, spa, or other outlets. Using these templates ensures consistency in data collection and allows the hotel to monitor guest experiences across various service areas.


1. When you are on the Dashboard landing page, ensure you are in the Connect Platform and click on the SURVEY BUILDER tab. This section allows you to create, customize, and manage survey templates tailored to different guest experiences. You can design questions, adjust formats, and select specific survey types (After Stay, General, or Outlet) to gather the most relevant feedback for your needs.


After Stay Survey – This survey is conducted after the guest has departed. It is designed to gather feedback on the overall experience, including satisfaction with services, facilities, and staff interactions, helping the hotel identify strengths and areas for improvement.


General Survey – This survey is sent to guests who have recently stayed at the hotel. It captures feedback on their stay experience, covering key aspects such as service quality, amenities, and overall satisfaction, providing valuable insights for continuous improvement.


Outlet Survey – This survey is designed to gather feedback on a guest’s experience in specific hotel outlets, such as restaurants, bars, or spas. It evaluates elements like food and beverage quality, service, ambiance, décor, and overall atmosphere, providing insights into how each outlet meets guest expectations.


If you need further assistance, please send an email to helpdesk@q-tx.com
Connect: How to View the list of Available Location as a Group User

The Location section in the Connect Platform Settings provides an overview of all the properties registered within the system. You will also be able to see the department associated with each location.


 1. From the Dashboard landing page, click on the “SETTINGS” button located in the upper right corner of the screen.


2. After clicking the Settings icon, choose “Manage Locations.


3. The system will take you to the Connect Platform Settings. Click on the “LOCATION” tab, then scroll down until you reach the list of available locations.


If you need further assistance, please send an email to helpdesk@q-tx.com
Connect: How to View Satisfaction Rate and Global Score of Owned vs. Leased Outlet

The QTX system provides a detailed Satisfaction Rate and Global Score for both Company-owned and Leased outlets, displayed separately in graph and table formats. It also includes a performance indicator that helps departments and management evaluate success in achieving specific targets.

  • Satisfaction Rate measures the percentage of positive responses from guests or users based on their direct feedback. This reflects how well the service, product, or experience met or exceeded expectations. A high Satisfaction Rate indicates strong performance in guest engagement, service quality, and operational consistency, while a lower rate highlights areas that require improvement.

  • Global Score is a comprehensive performance index that combines multiple evaluation criteria—including service standards, compliance checks, and overall guest experience—into a single score. Unlike the Satisfaction Rate, which is primarily guest-driven, the Global Score provides a broader, balanced perspective by integrating both guest feedback and operational standards. This allows management to identify trends, benchmark results across different outlets, and track progress against strategic goals.

By comparing both indicators, organizations gain deeper insights: the Satisfaction Rate highlights customer sentiment, while the Global Score reflects the overall operational and service excellence.


1. On the Dashboard landing page, click Reports under the CONNECT platform, then select Response Analyses.


2. Fill in the required filter details, then generate and view the report.


3. You will be directed to the Performance tab. Click Performance, then select Owned vs Leased Outlet, and choose Satisfaction Rate or Global Score.


4. The Overall Satisfaction Rate graph will be displayed. Hover your cursor over any bar in the graph to view the exact percentage score.


5. Next, the system will display the Overall Owned Outlets graph. Hover your cursor over any bar to view the exact percentage score for each outlet.
Click the VIEW MORE button to display the table view of each outlet.


6. The next section displays the Owned Outlet report with Key Metrics Scores by Department in a table format. This indicates if each department performance has increased or decreased.


8. Next, you can view the Leased Outlets report in a graph format, similar to the Owned Outlets display for your reference. Click VIEW MORE at the bottom to see additional details. (Image needs to be updated).


If you need further assistance, please send an email to helpdesk@q-tx.com

Connect: How to View Performance Report

This report provides a detailed measurement of staff performance based on satisfaction levels and scores. It highlights the performance outcomes of a specific group or department, enabling management to identify areas of growth, monitor progress, and assess the overall performance of the organization.


1. When you are on the Dashboard landing page, click on “Reports” under the CONNECT platform.


2. Click on “Response Analyses” under Reports. Next, fill in the required details in the Filters section. Make sure you are on the “Performance” tab to proceed.


3. The system will first display the overall performance report, showing both the Satisfaction Rate and the Global Score.


4. The table below displays the scores for the key metrics, highlighting whether performance has improved or declined.


5. The information can be viewed by the selected number of entries. Hover your cursor over the “Response Ratio” box to display additional details in a pop-up box below.


6. Below, a table summarizes departmental performance, showing the Department, the corresponding Survey Question, and the most recent scores. It also compares results against previous data (Vs Prev.), indicates performance improvement or decline (P.I.), and shows the number of responses collected (# of R.).

This layout allows management to quickly assess guest satisfaction levels across key service areas such as Check-In Experience, Concierge Services, and Guest Room/Suite, while tracking performance trends over time.


If you need further assistance, please send an email to helpdesk@q-tx.com

Perform: How to Assign an Assessment as a Group User

Web or Mobile App-Based Testing – Assigning Assessments

Web or mobile-based assessments allow inspectors to answer specific questions and upload related media (images, video, audio) with commentary. Only assigned Inspectors can complete these assessments.

1. From the Dashboard landing page, click the “PERFORM” button.


2. Then select “Assessments.”


2. Click “Assignments” under the Assessments menu, then click the “ASSIGN ASSESSMENT” button.


3. Fill in all the required details by selecting the appropriate options from the dropdown lists (e.g., location, section, department, assessment name, inspector).


4. Choose your preferred Assign Type:

  • “ONCE” – for a one-time assessment

  • “RECURRING” – for multiple or scheduled assessments (you can select multiple days)


5. Set the Start Date, Send Time, and End Date for the assessment.

Once everything is complete, click the “ASSIGN” button to save and finalize the assignment.


If you need further assistance, please send an email to helpdesk@q-tx.com