Connect: How to do Comparison by Filters

Comparing data helps to highlight the advantages and disadvantages and to examine strengths and weaknesses. It enables users to identify patterns, track performance over time, and make informed decisions. By analyzing similarities and differences, data comparison supports better problem-solving, strategic planning, and continuous improvement.


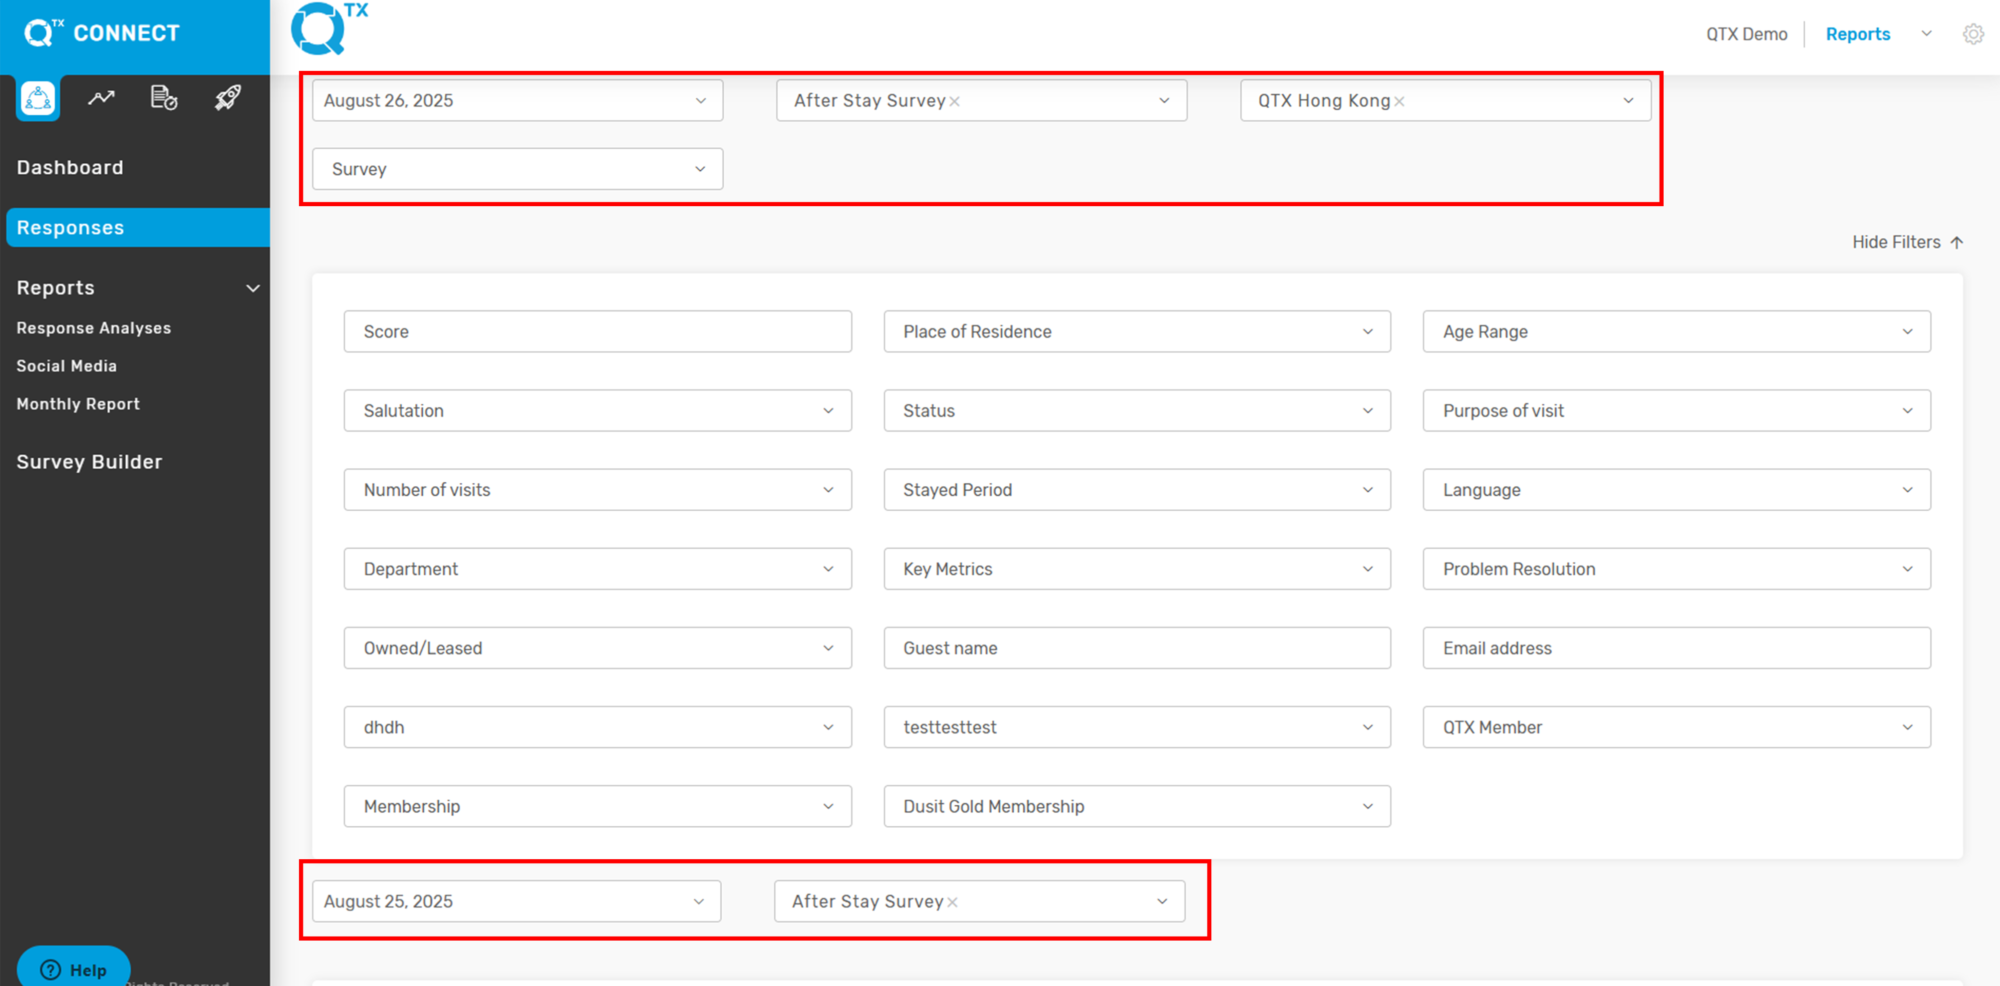
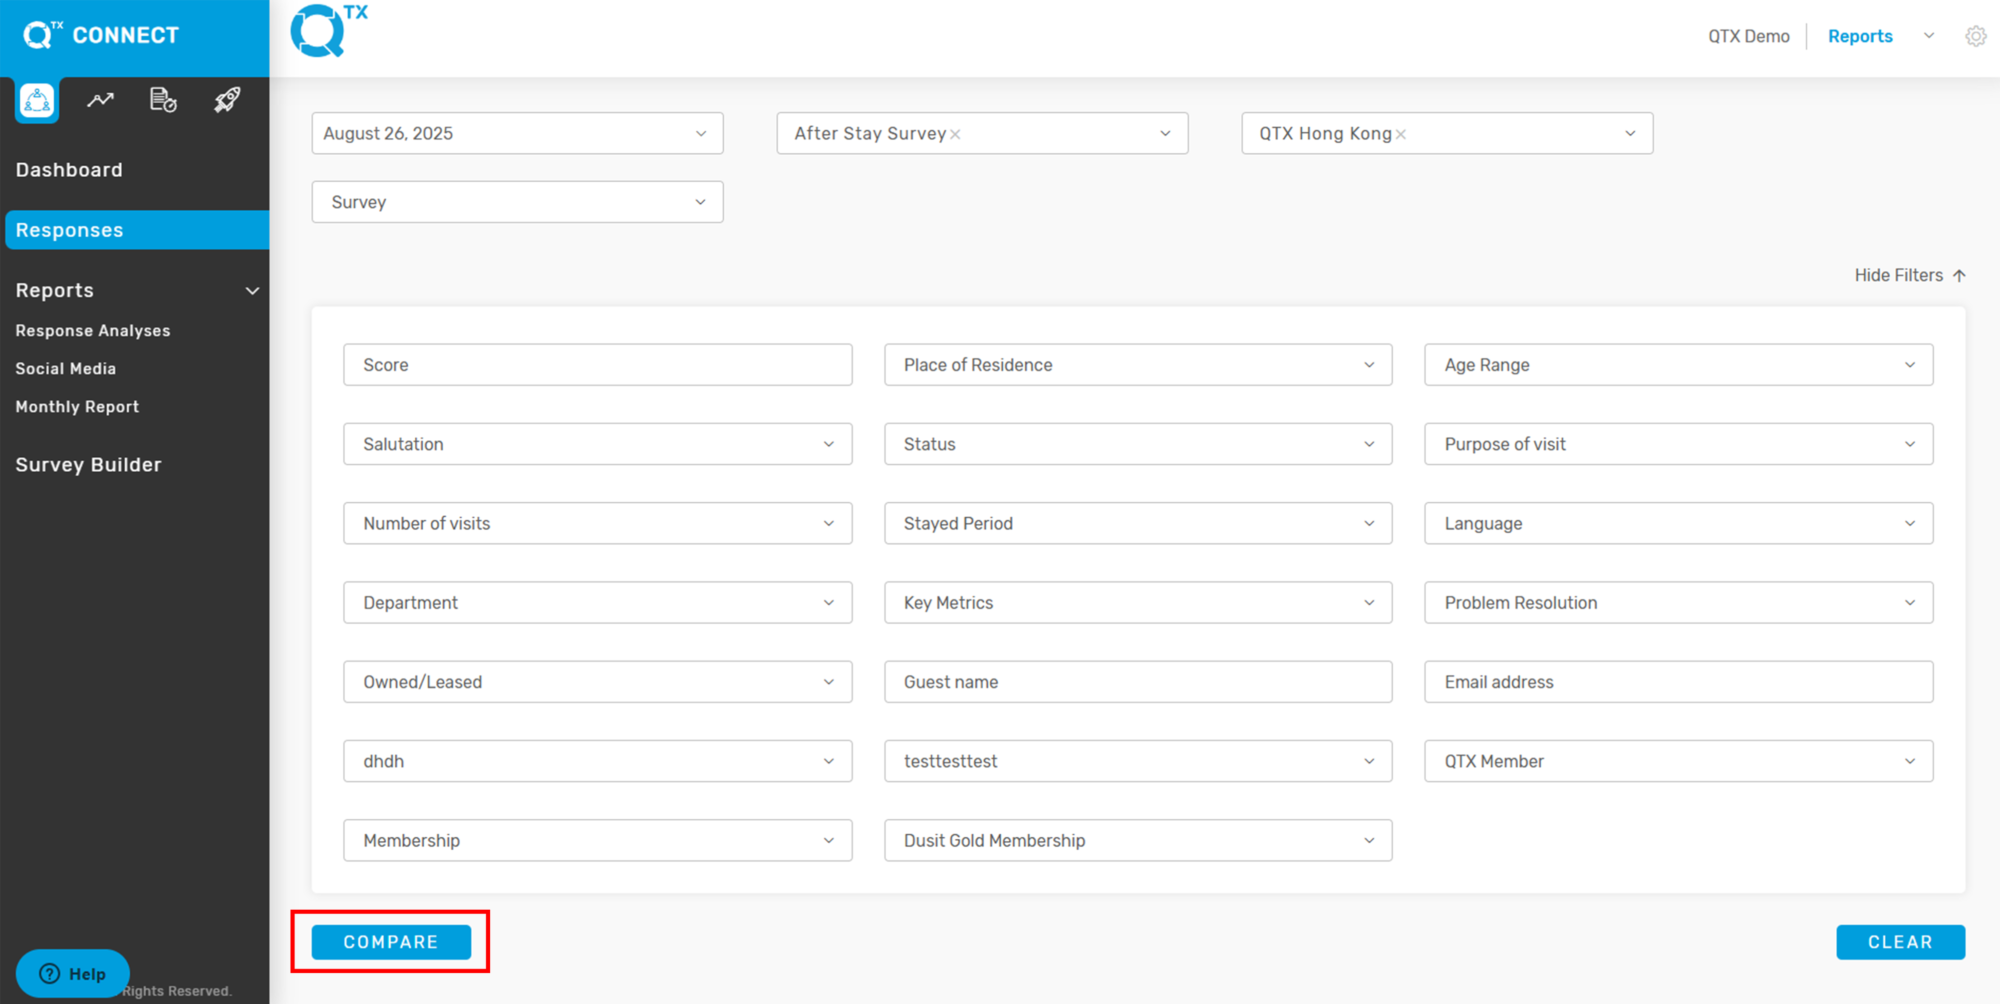
1. From the Dashboard landing page, select your preferred Dashboard under any platform. Then, click Compare to enter the required details.


2. Fill in the details for Filter One by selecting the appropriate information from the list. Repeat the same steps to complete the data for Filter Two.


3. The system will generate and display the reports based on the applied filters


If you need further assistance, please send an email to helpdesk@q-tx.com

Connect: How to Create an Inspector Account

A user with an Inspector account is qualified to review and evaluate a variety of services and amenities at hotels. Inspectors visit selected locations or departments as typical guests and assess both the services and facilities they experience. Their evaluations are guided by a predefined assessment, which is accessible and responsive across all devices.


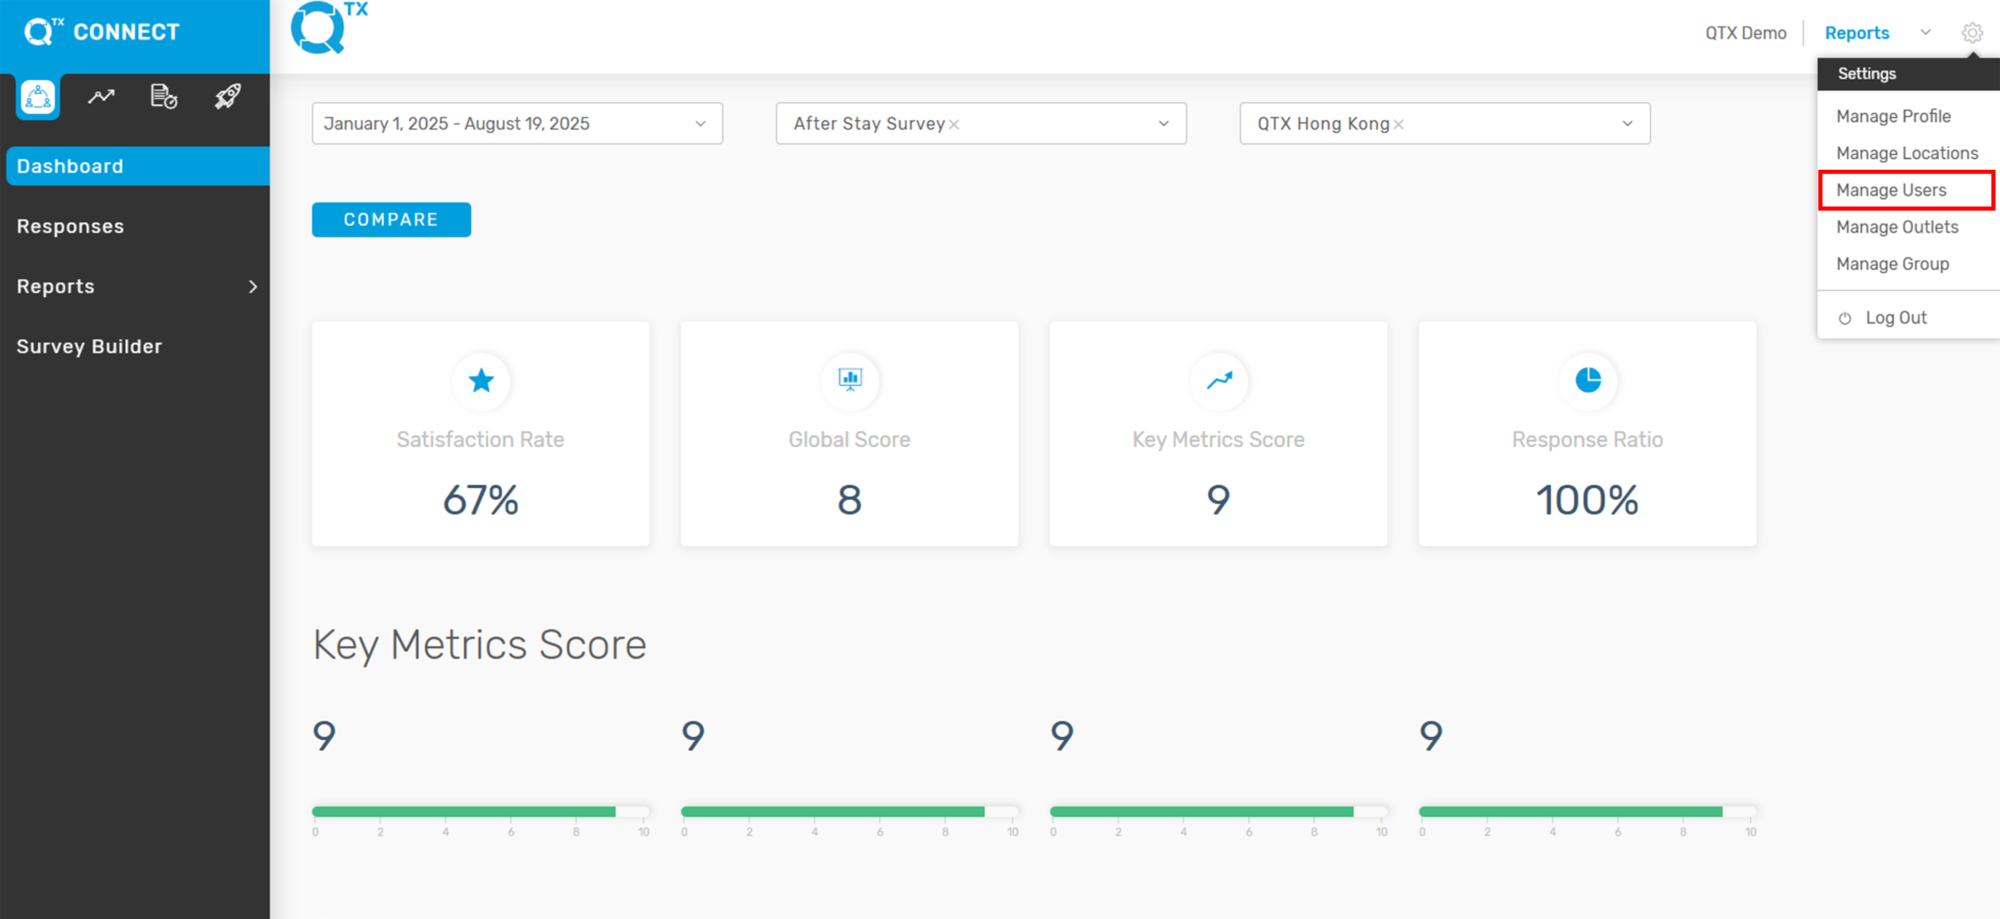
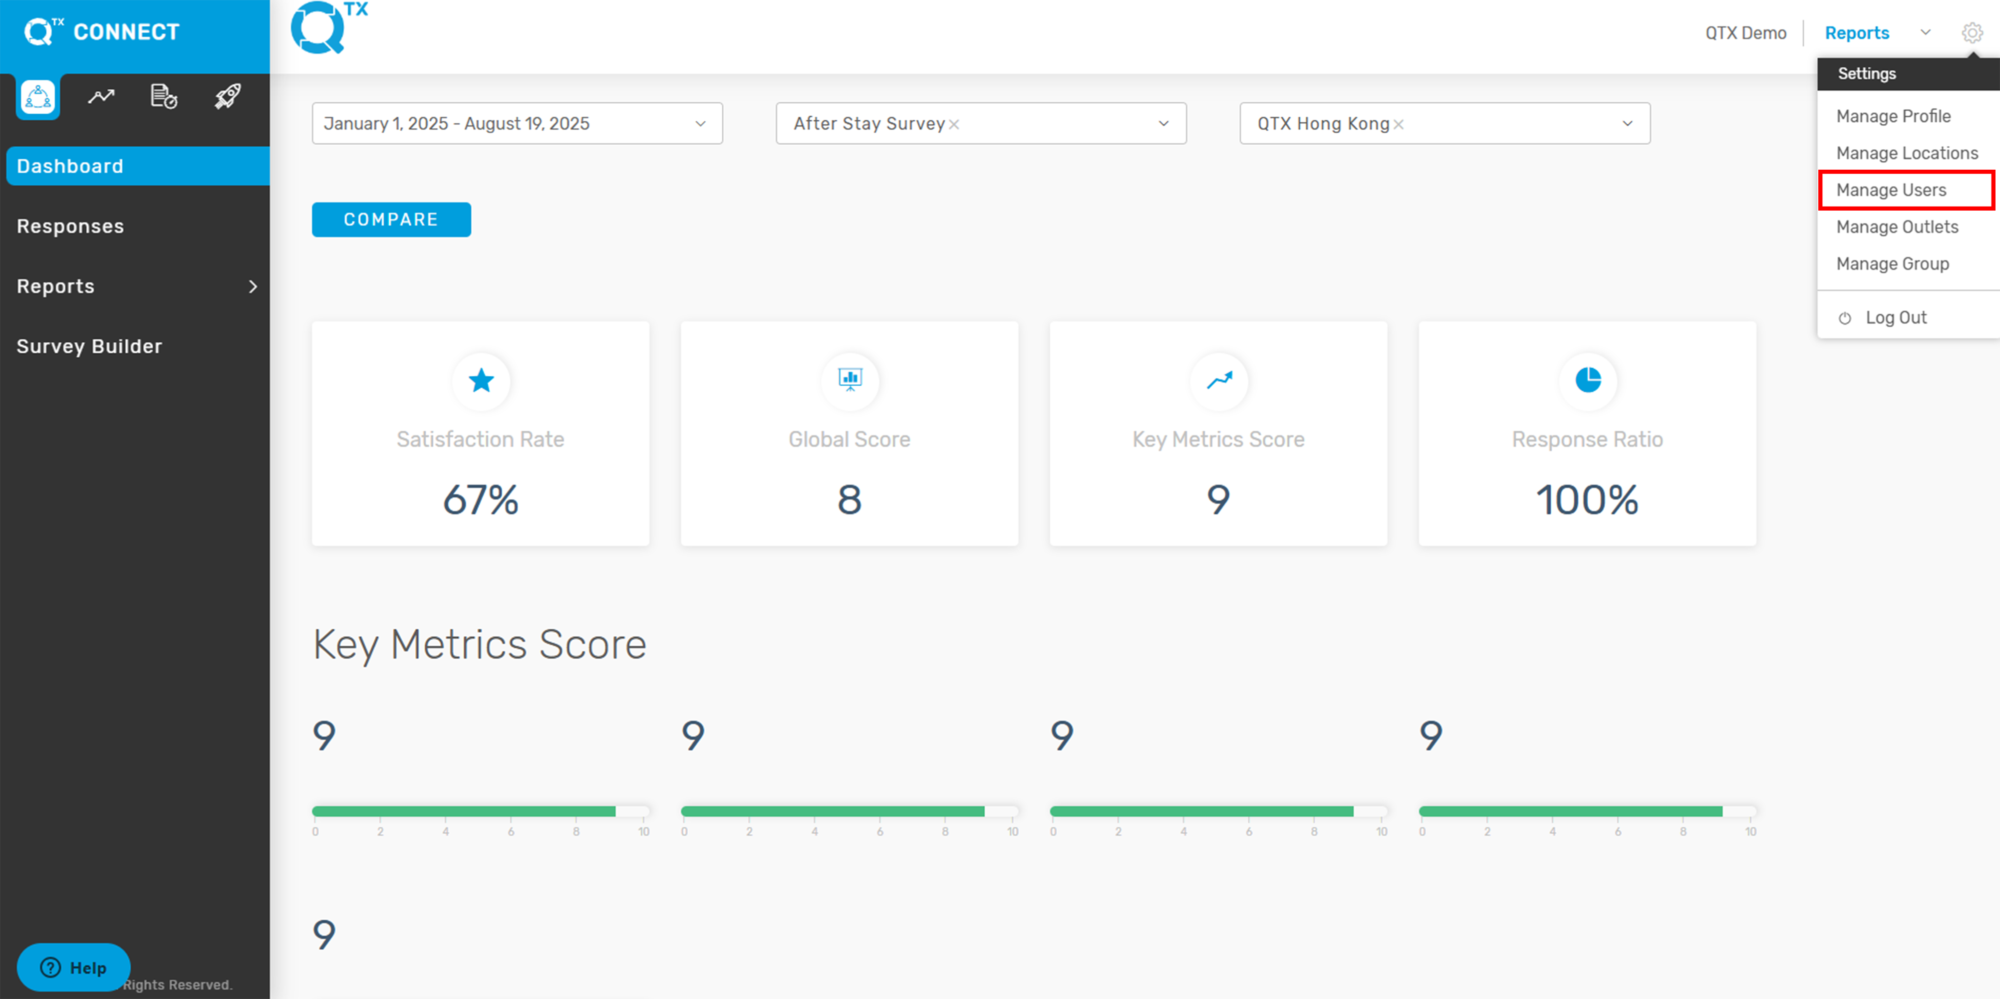
1. On the Dashboard landing page, click the Settings icon in the upper right top corner.


2. Select Manage Users.


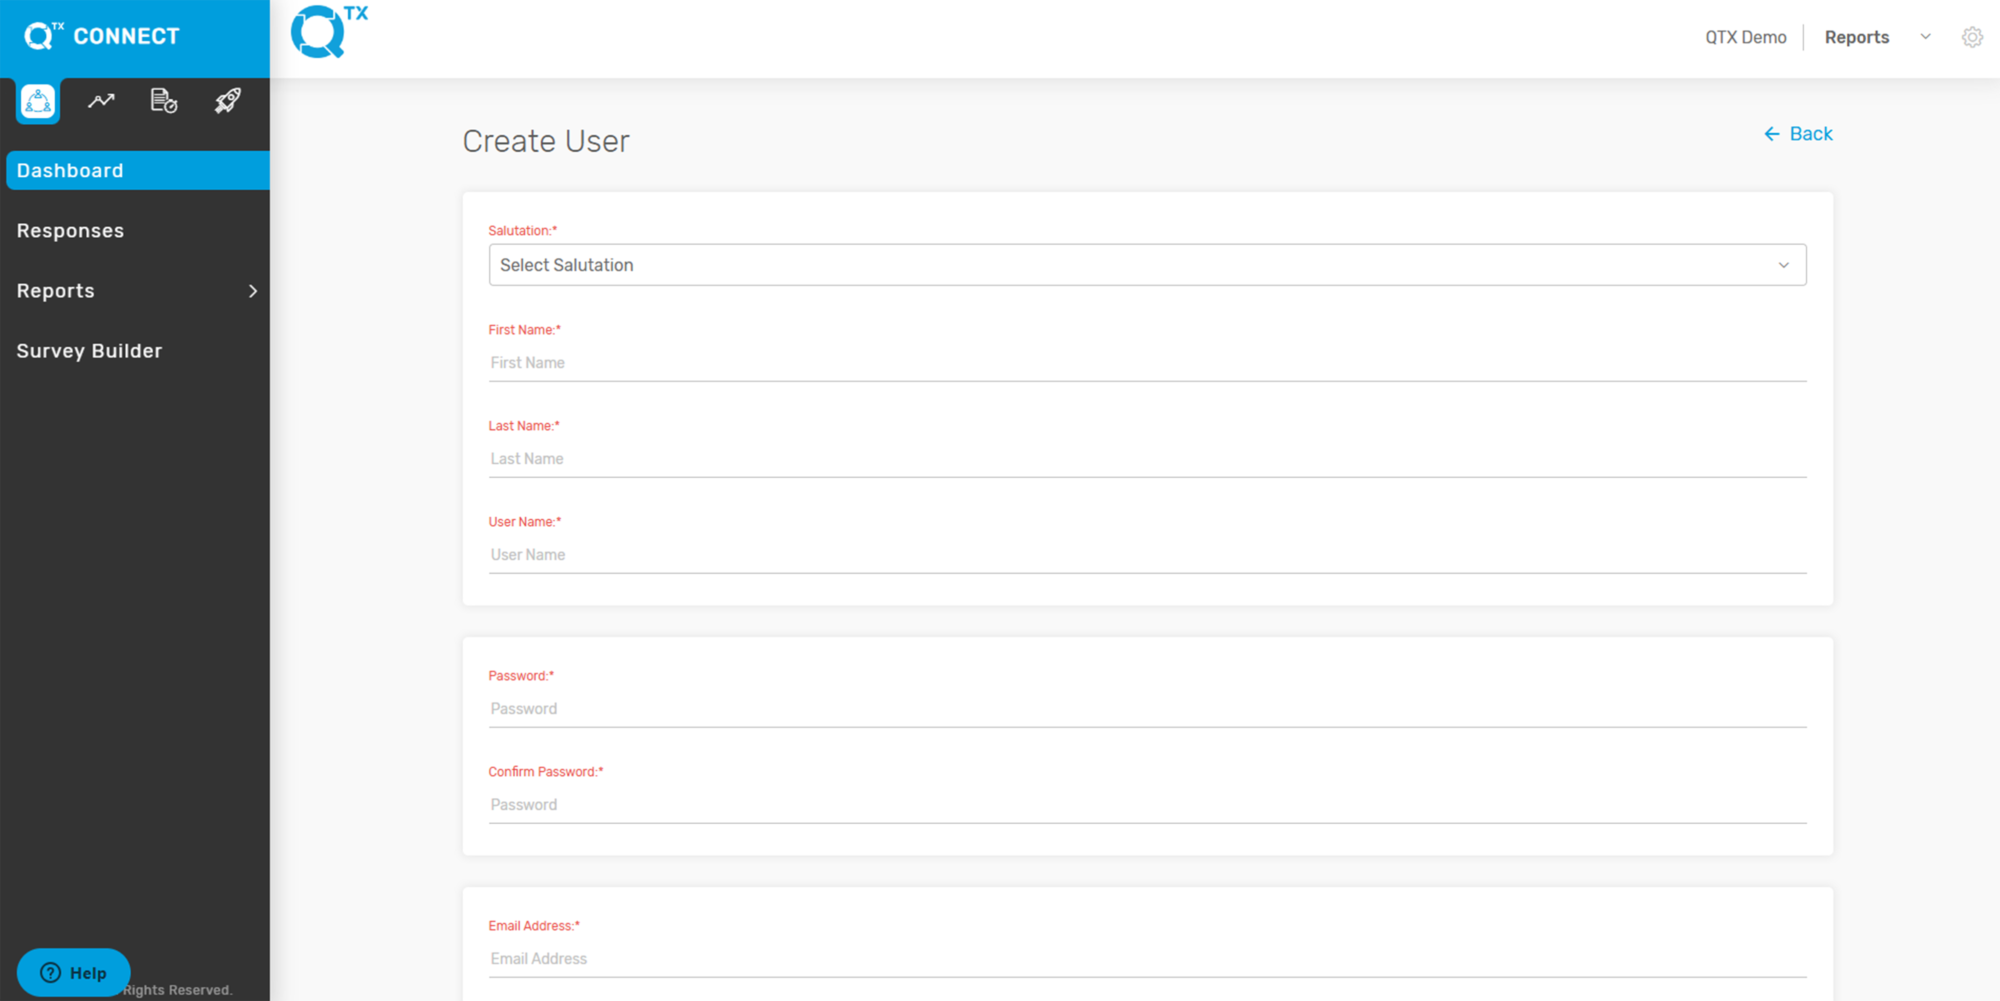
3. Click “Create a User”.


4. Fill in the necessary information by clicking on the empty boxes.


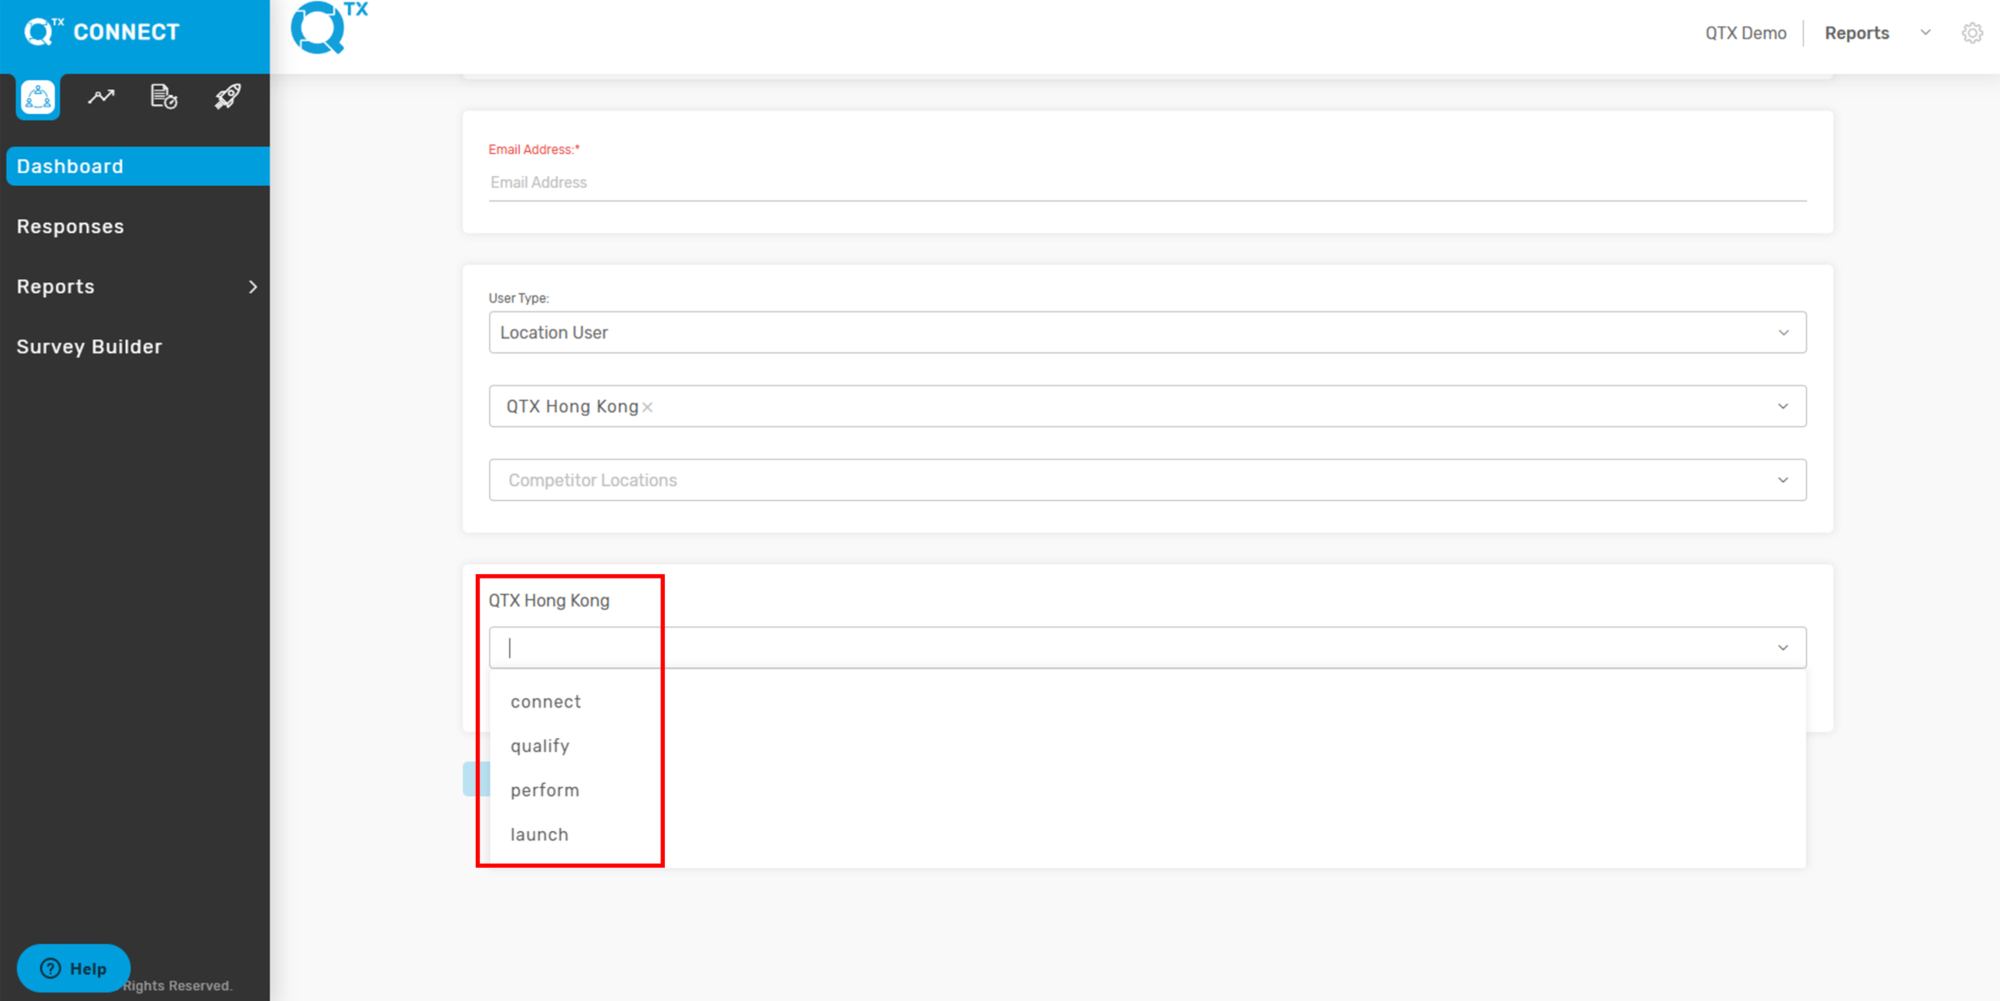
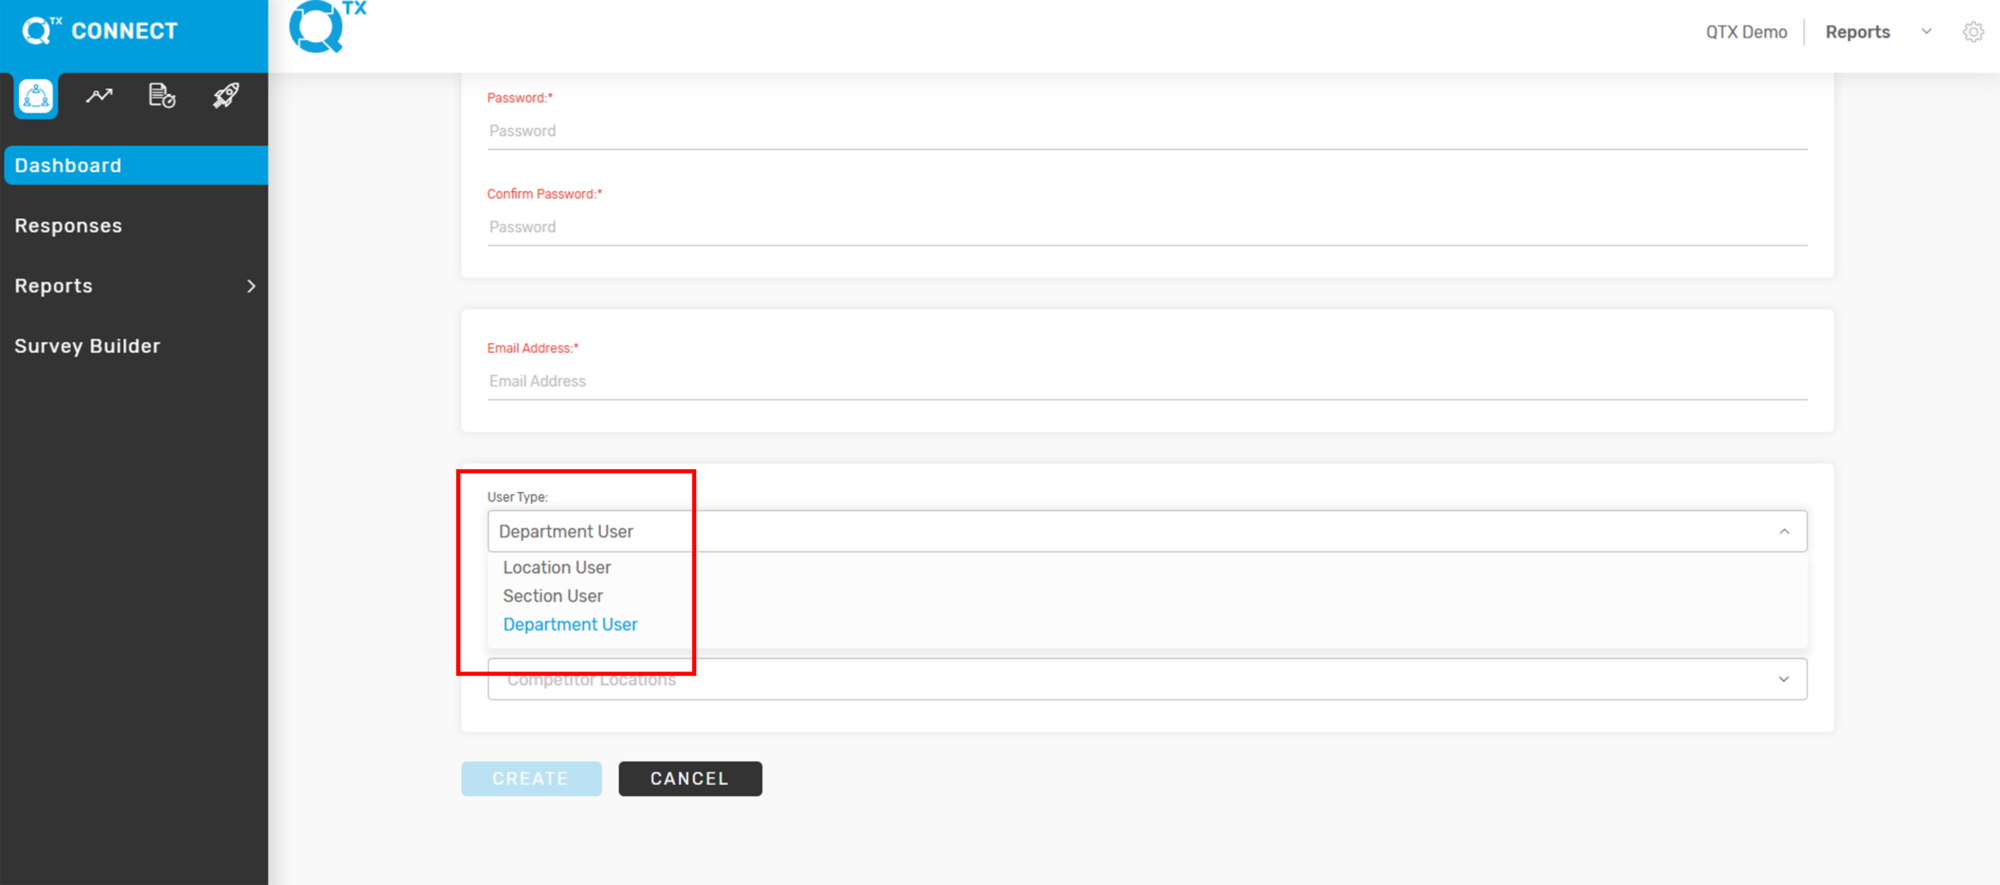
5. Select User Type and Location/Section/Department from the list by clicking the checkbox or using the drop-down arrow.


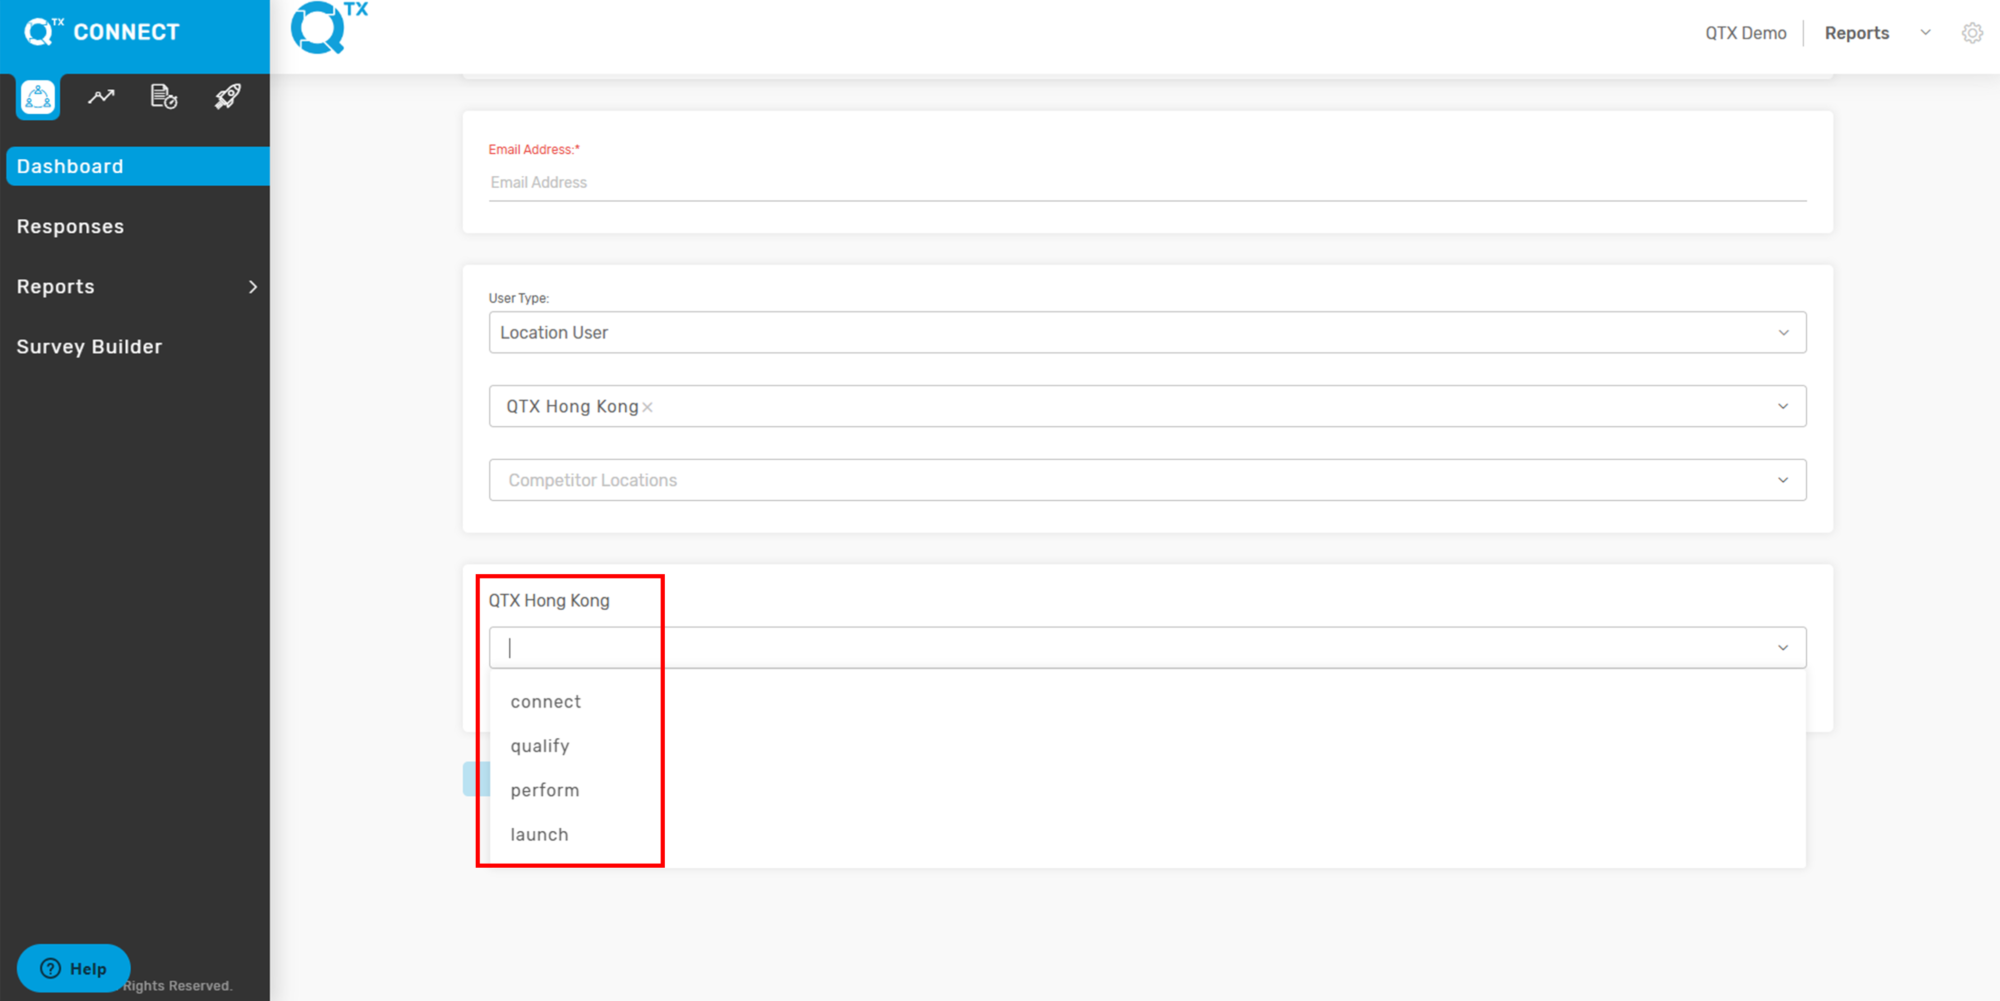
6. Once “User Type” and “Locations” buttons are filled in, another box will appear. The user has to select which Platform should apply in the selected Location.
Example: Macao as the Location


7. The user can select one or more Platforms.


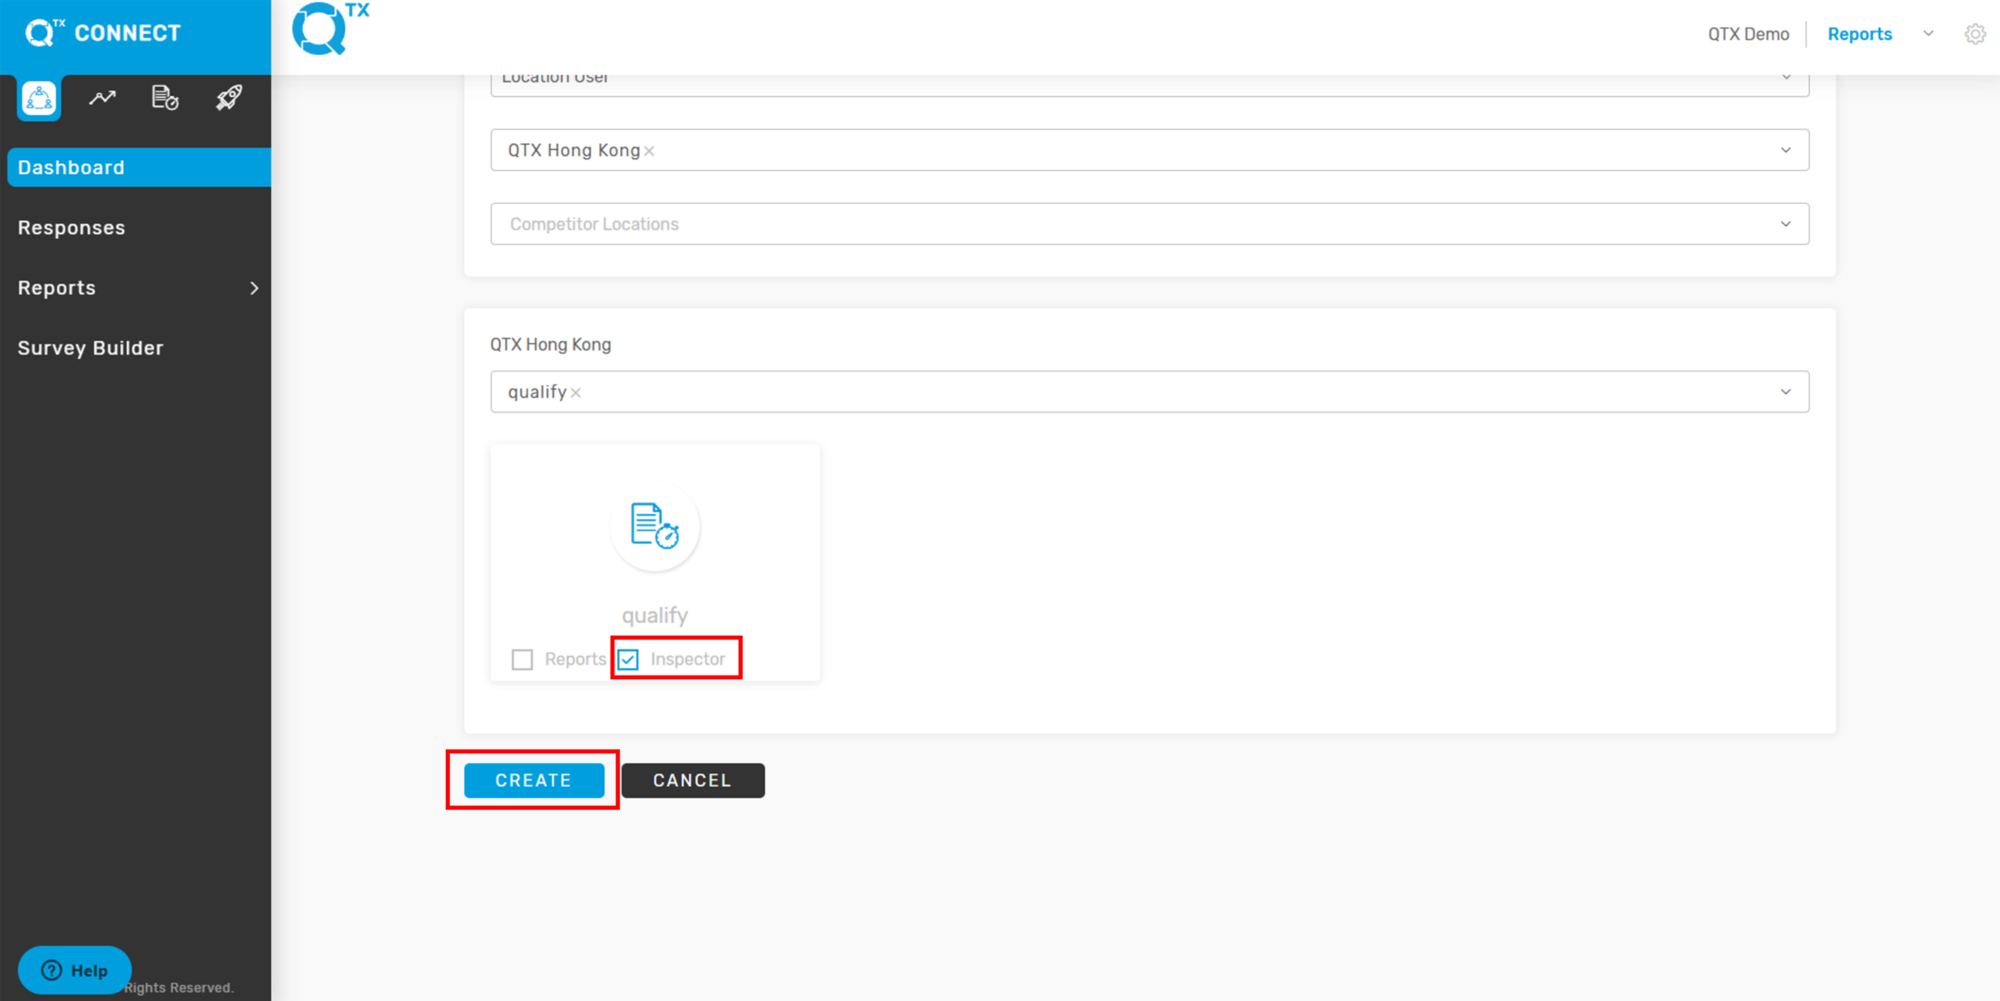
8. Click the box next to the word “Inspector” to provide access. Then click on the “Create” button to save and finish.


If you need further assistance, please send an email to helpdesk@q-tx.com

Connect: How to View Dashboard Reports

Dashboard Reports provide a comprehensive overview of a Group’s or Location’s performance indicators in real time. These reports not only allow management to monitor progress but also help ensure that service standards are consistently met. By capturing and presenting key performance data, Dashboard Reports enhance the quality of feedback collected from guests. This feedback can then be transformed into relevant, meaningful, and actionable insights—empowering frontline staff to improve service delivery, address issues promptly, and continuously elevate the guest experience.


1. On the Dashboard, enter the required information using the Filters function.


2. On the same page, hovering the cursor over the Response Ratio Rate will display details such as Surveys Sent and Responses Received from the assessment.


3. For the Key Metrics Score, hover the cursor over the line to view the standard associated with the score.


4. Satisfaction Rate – Hovering the cursor over the graph bar will display the outlet’s satisfaction rate along with the number of responses received.


5. Click “SHOW MORE” to display the complete details.


6. The Name, Satisfaction Rate (%), and Number of Responses will be displayed.


7. The Top 5 and Bottom 5 Areas, along with their corresponding scores, are displayed for easy reference. By reviewing this information, management can quickly identify the best-performing and lowest-performing departments based on the set standards. Scores below 80% are highlighted in yellow for visibility.


8. You will also see the Responses and Problem Resolution sections below the Top 5 and Bottom 5 areas. By hovering over the arrow, you can view additional responses provided by the system.


9. Response Ratio – Hovering the cursor over the graph line will display the number of surveys sent and the number of responses received. The graph can be customized to show either Surveys Sent or Responses Received by selecting the relevant checkbox.


If you need further assistance, please send an email to helpdesk@q-tx.com

Connect: How to Create a Reporting User

A user assigned with a Reporting role can generate reports only for the information they have access to within the Q-tx System. In other words, reporting capabilities are limited to the data and sections the user is permitted to view.

This User Guide provides a clear, step-by-step process for creating a Reporting User Account.


1. On the Dashboard landing page, click the Settings icon located in the upper-right corner of the screen.


2. From the drop-down menu, select Manage Users.


3. On this page, click the CREATE A USER button to begin creating a new account.


4. Make sure to select a salutation, then fill out the First Name and Last Name fields. Next, create a username (for example: firstname.lastname), set a password, and enter the user’s email address.


5. Select the appropriate User Type.


6. Select the assigned Location or Property for the user.


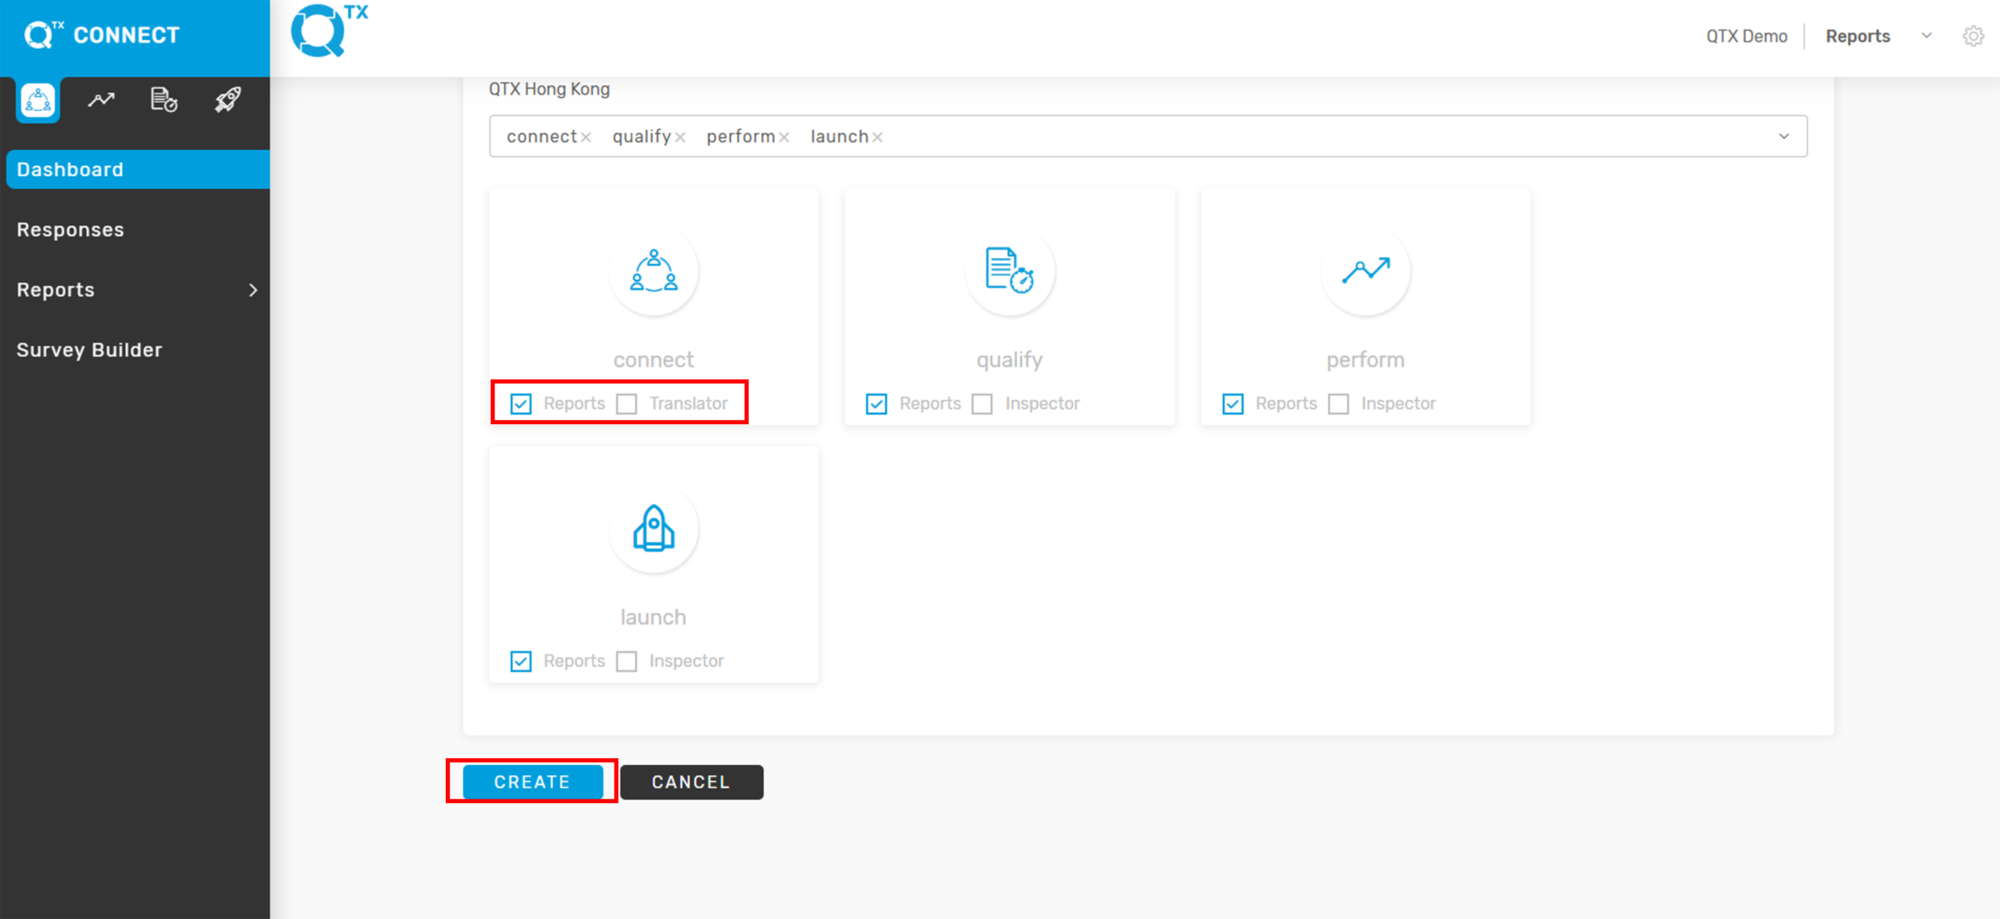
7.. Select the platform and click CONNECT, PERFORM, QUALIFY or LAUNCH.


8. Check the REPORTS box for all selected platforms. Once all required details are completed, click CREATE to save and finish.


If you need further assistance, please send an email to helpdesk@q-tx.com
Perform: How to Assign an Assessment as a Group User

Web or Mobile App-Based Testing – Assigning Assessments

Web or mobile-based assessments allow inspectors to answer specific questions and upload related media (images, video, audio) with commentary. Only assigned Inspectors can complete these assessments.

1. From the Dashboard landing page, click the “PERFORM” button.


2. Then select “Assessments.”


2. Click “Assignments” under the Assessments menu, then click the “ASSIGN ASSESSMENT” button.


3. Fill in all the required details by selecting the appropriate options from the dropdown lists (e.g., location, section, department, assessment name, inspector).


4. Choose your preferred Assign Type:

  • “ONCE” – for a one-time assessment

  • “RECURRING” – for multiple or scheduled assessments (you can select multiple days)


5. Set the Start Date, Send Time, and End Date for the assessment.

Once everything is complete, click the “ASSIGN” button to save and finalize the assignment.


If you need further assistance, please send an email to helpdesk@q-tx.com