
This displays a summary of the questions that have been achieved and not achieved by the department. The percentage score is presented in both pie chart and table formats.
1. On the Dashboard landing page, click the “QUALIFY” button to proceed.

2. Click on the “Reports” button, then select “Performance”.
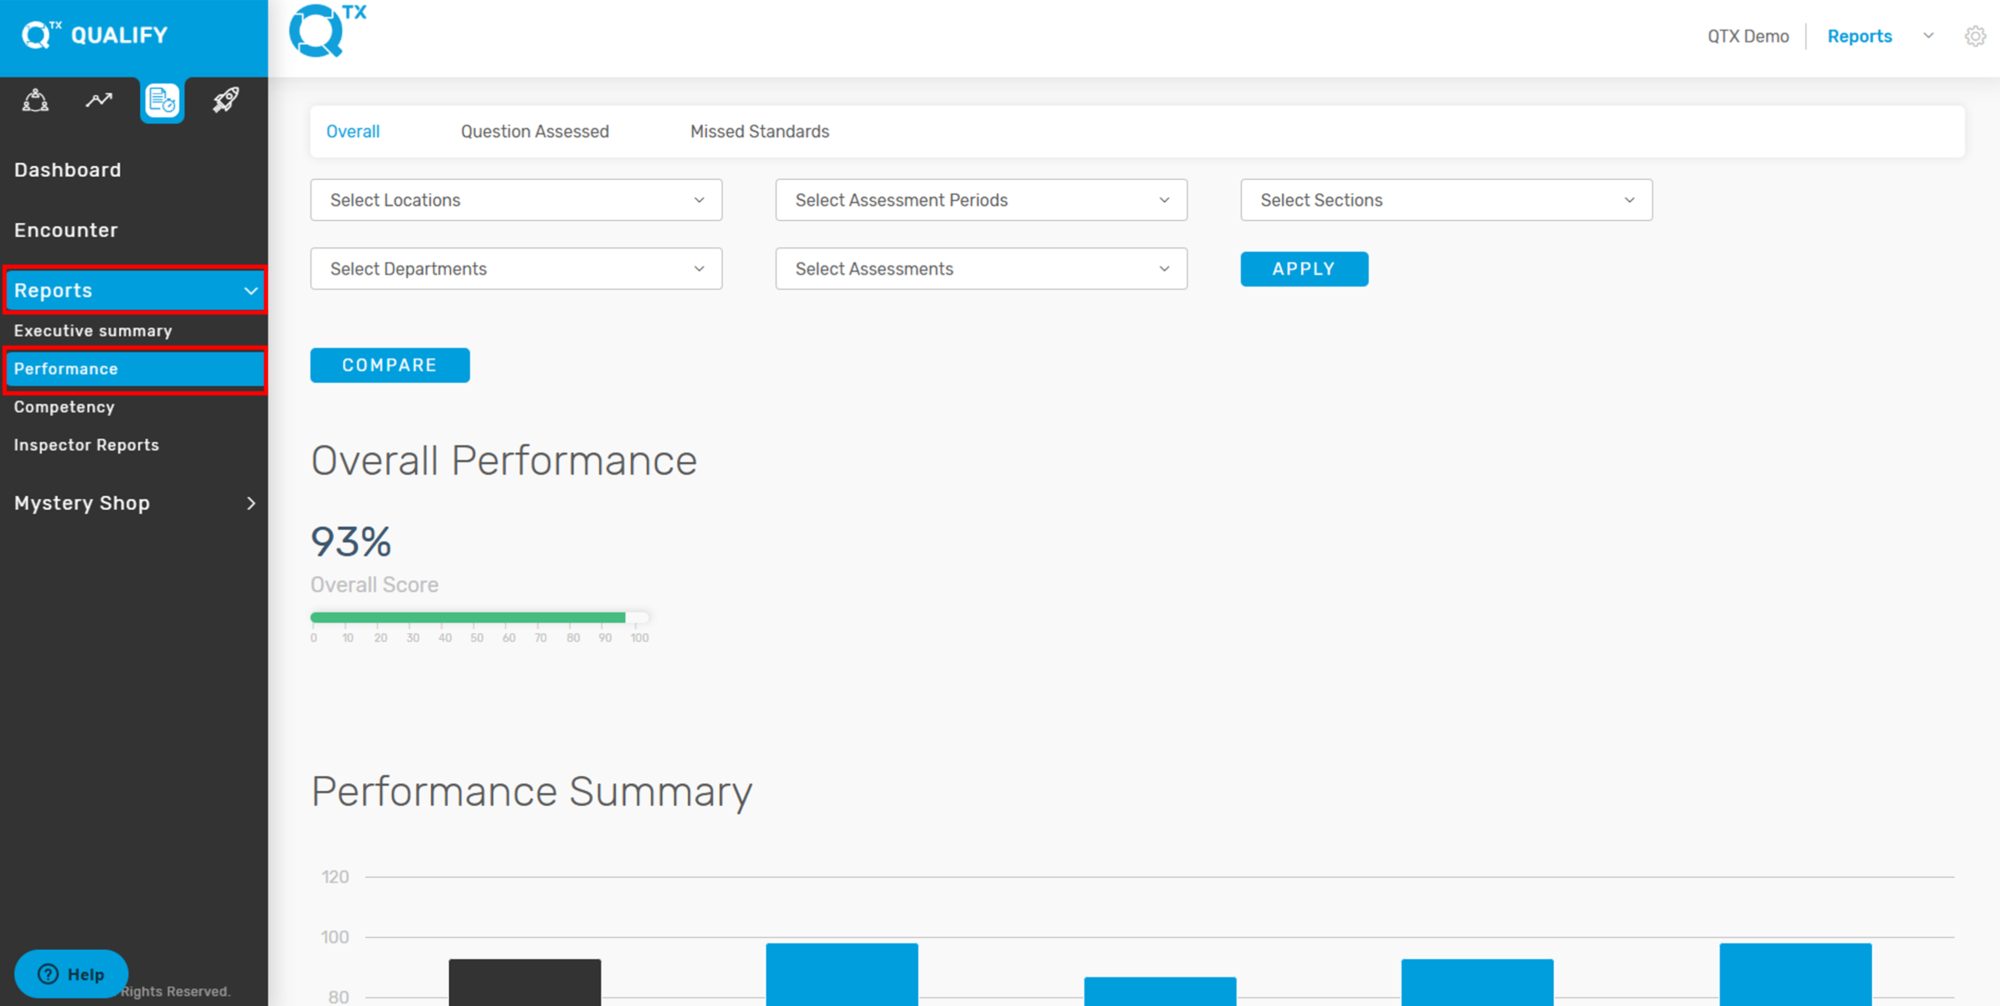
3. Click the “Question Assessed” Tab. Then, use the selection list to filter and choose the specific information you want to view.
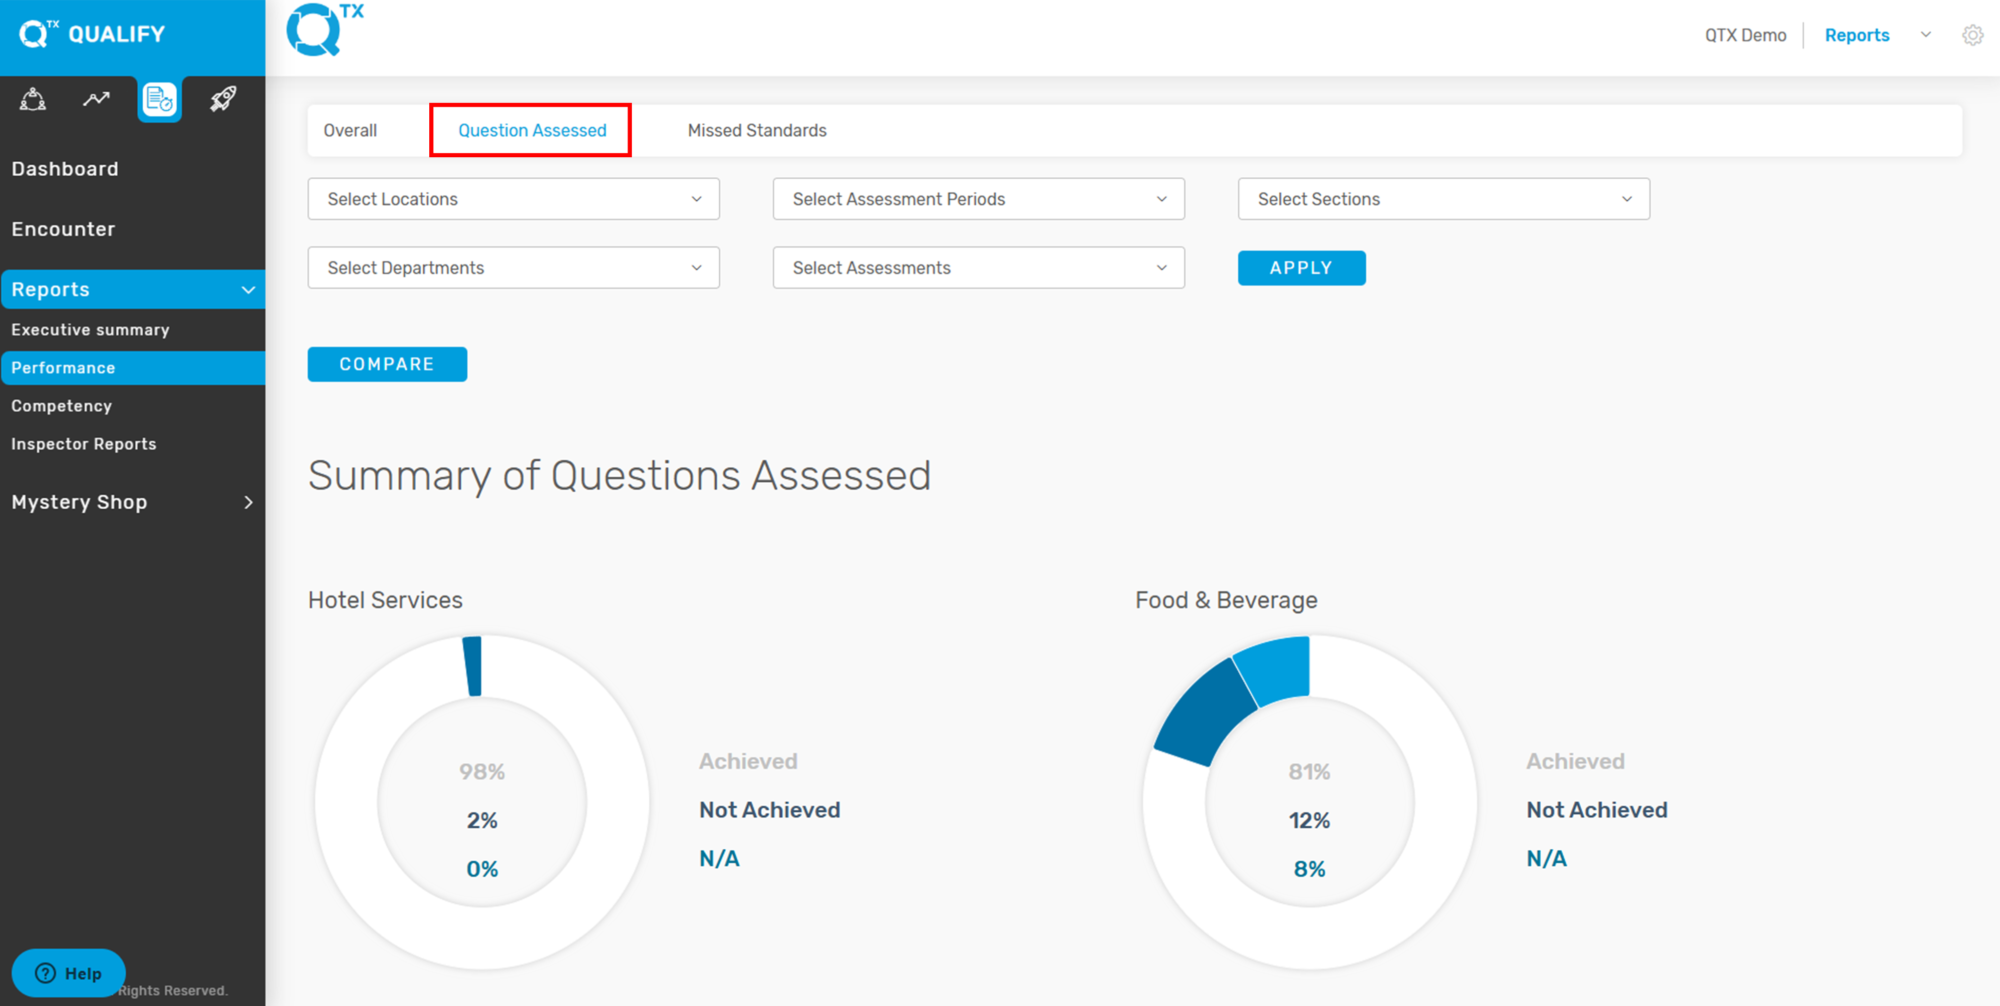
4. The system will display a summary of the assessed questions as a percentage, shown in a pie chart.
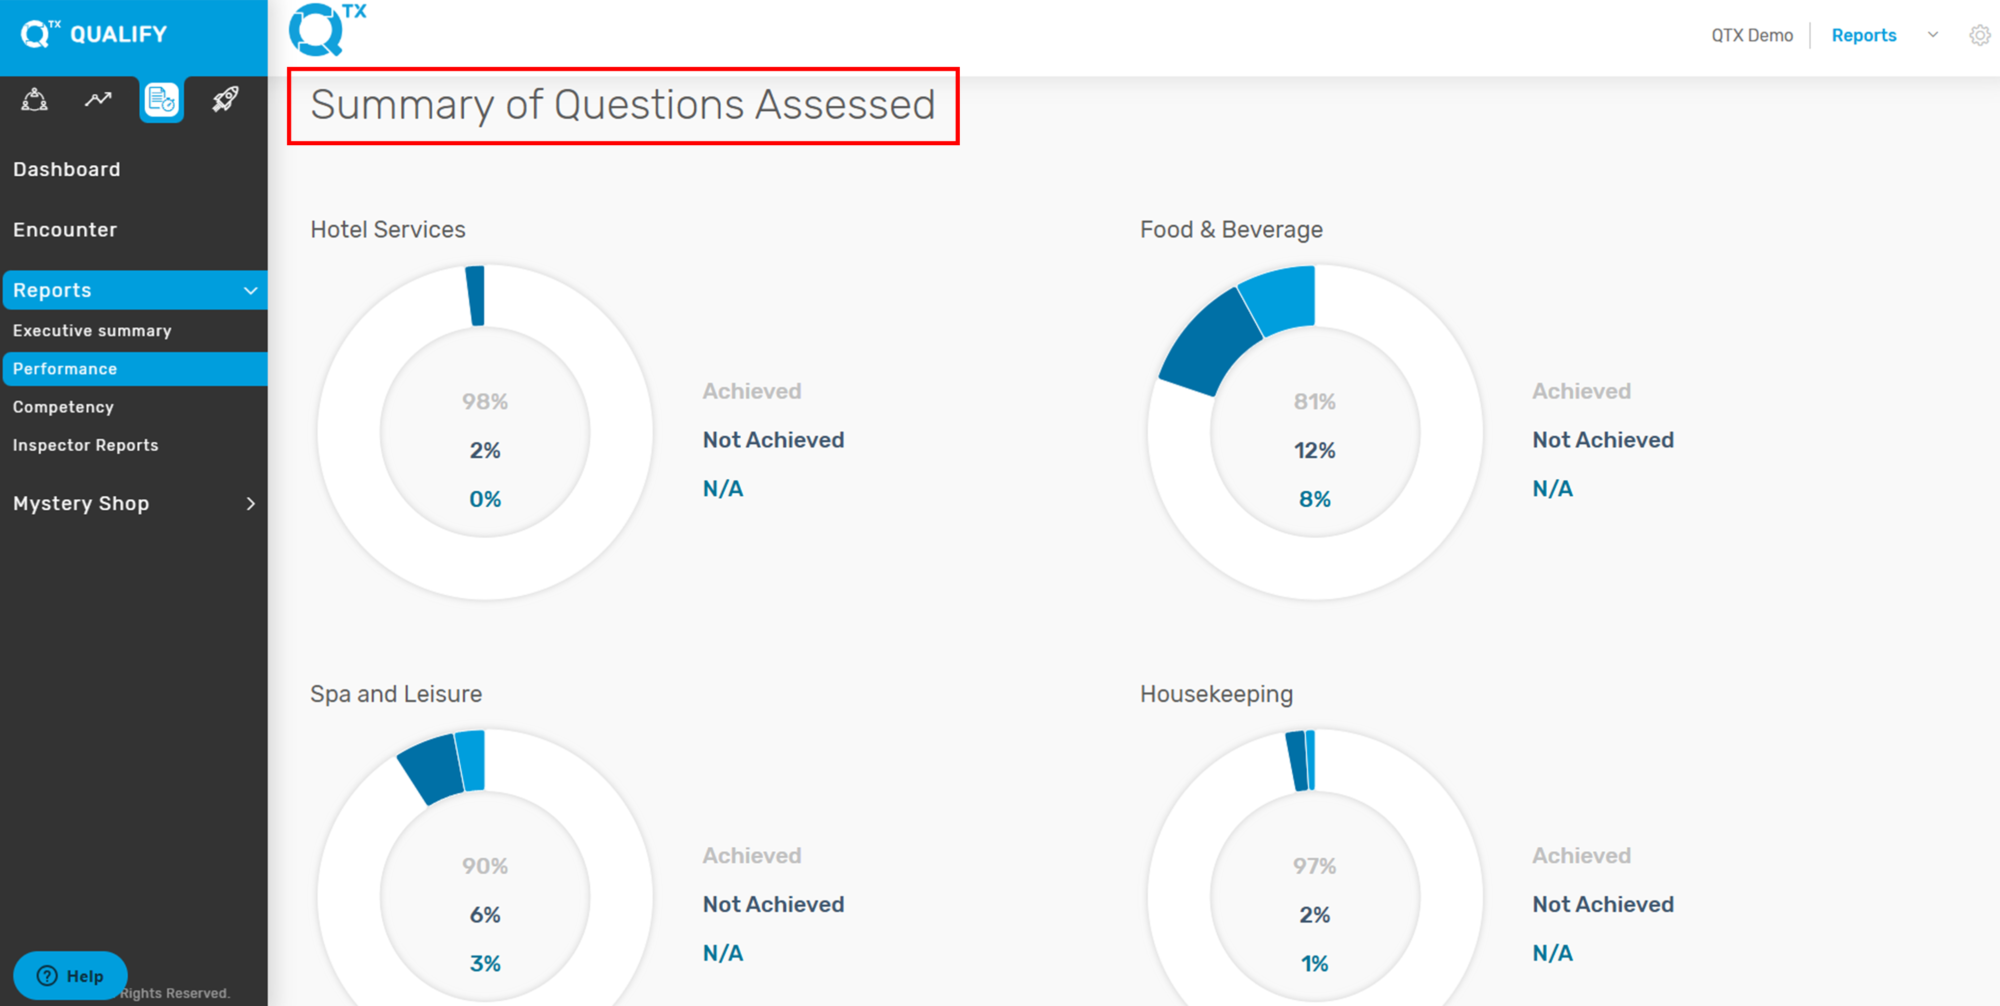
5. This table helps provide a clear overview of how each department performed in its assessments. By showing the percentage of Achieved, Not Achieved, and N/A responses, it allows users to quickly identify strengths and areas for improvement.
The N/A (Not Applicable) score is important because it indicates questions that were not relevant to the specific department or situation. These are excluded from the final performance calculation to ensure the score accurately reflects only the applicable criteria. This prevents departments from being unfairly scored on items outside their scope of responsibility.

If you need further assistance, please send an email to helpdesk@q-tx.com