Qualify: How to View Number of Missed Standards Report in Performance

This displays the number and percentage of missed standards for a department and/or section, based on the selected Assessment Name.


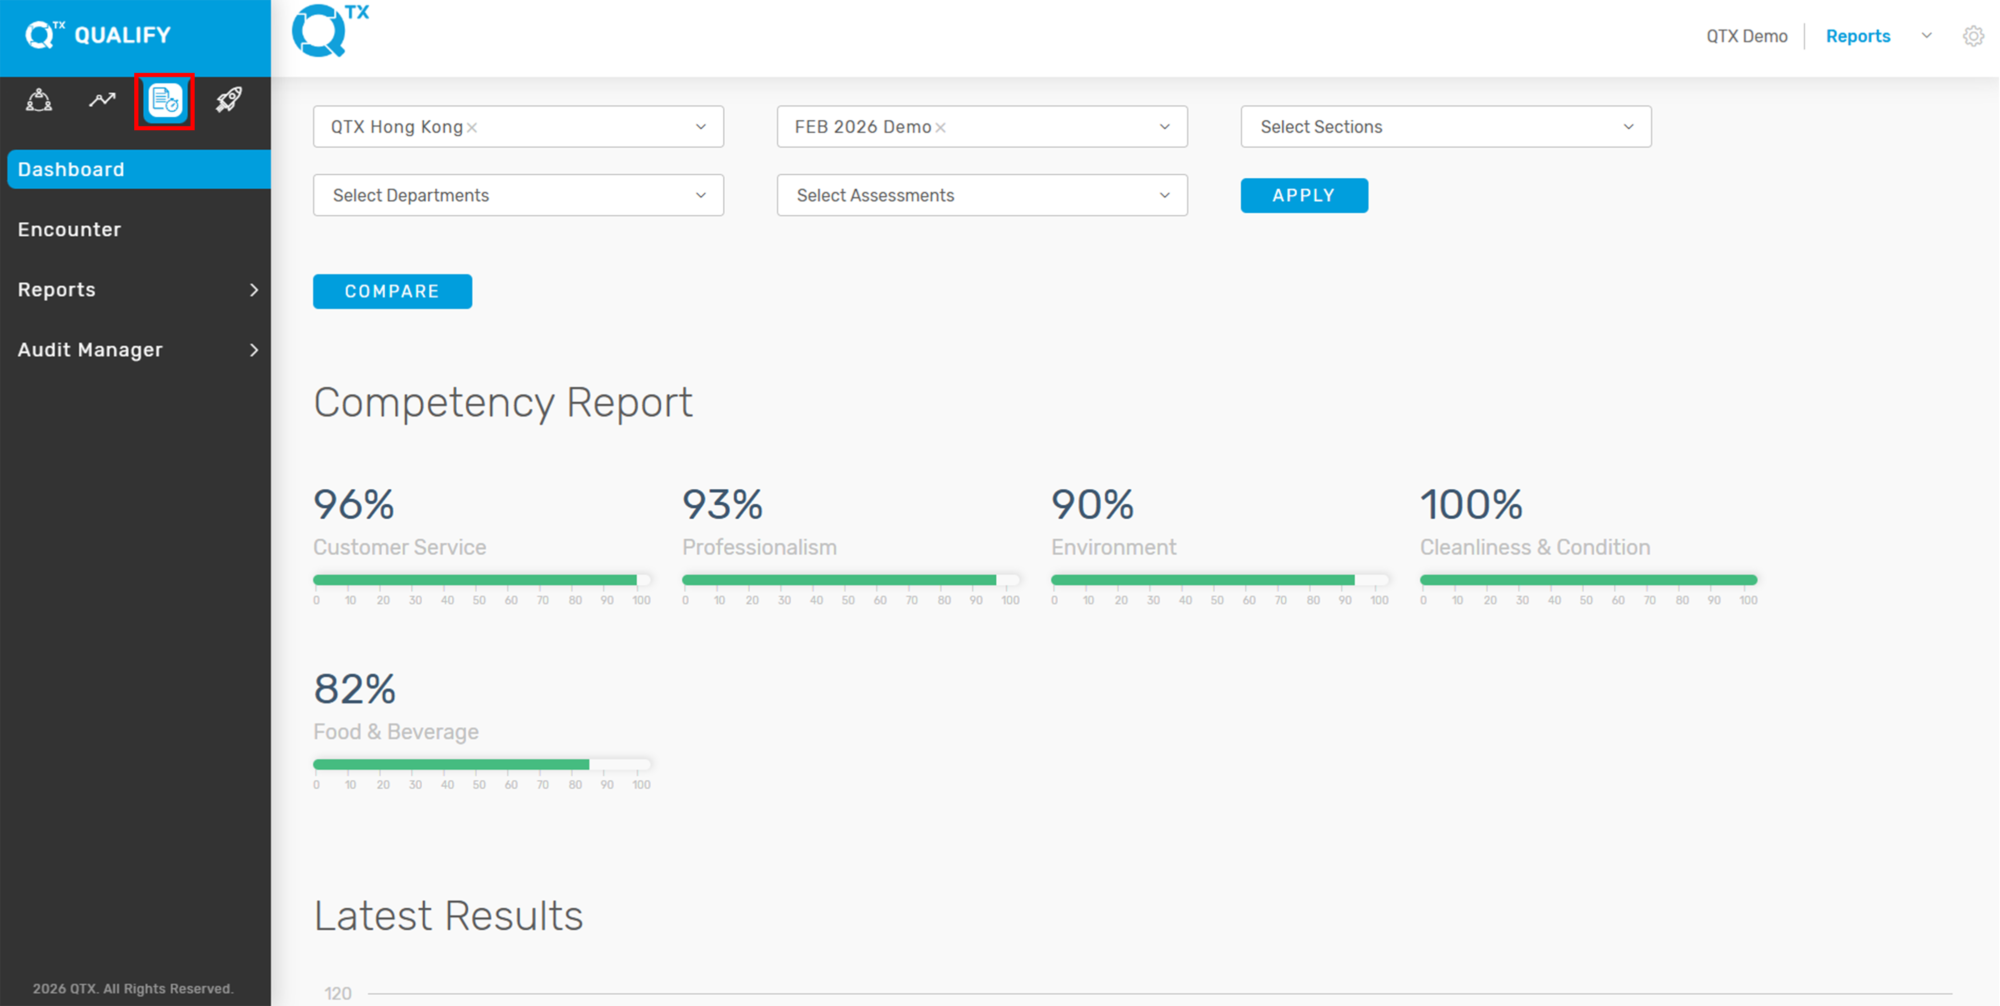
1. On the Dashboard landing page, click the “QUALIFY” button to proceed.


2. Click the “Reports” button, then select “Performance” from the dropdown menu to proceed.


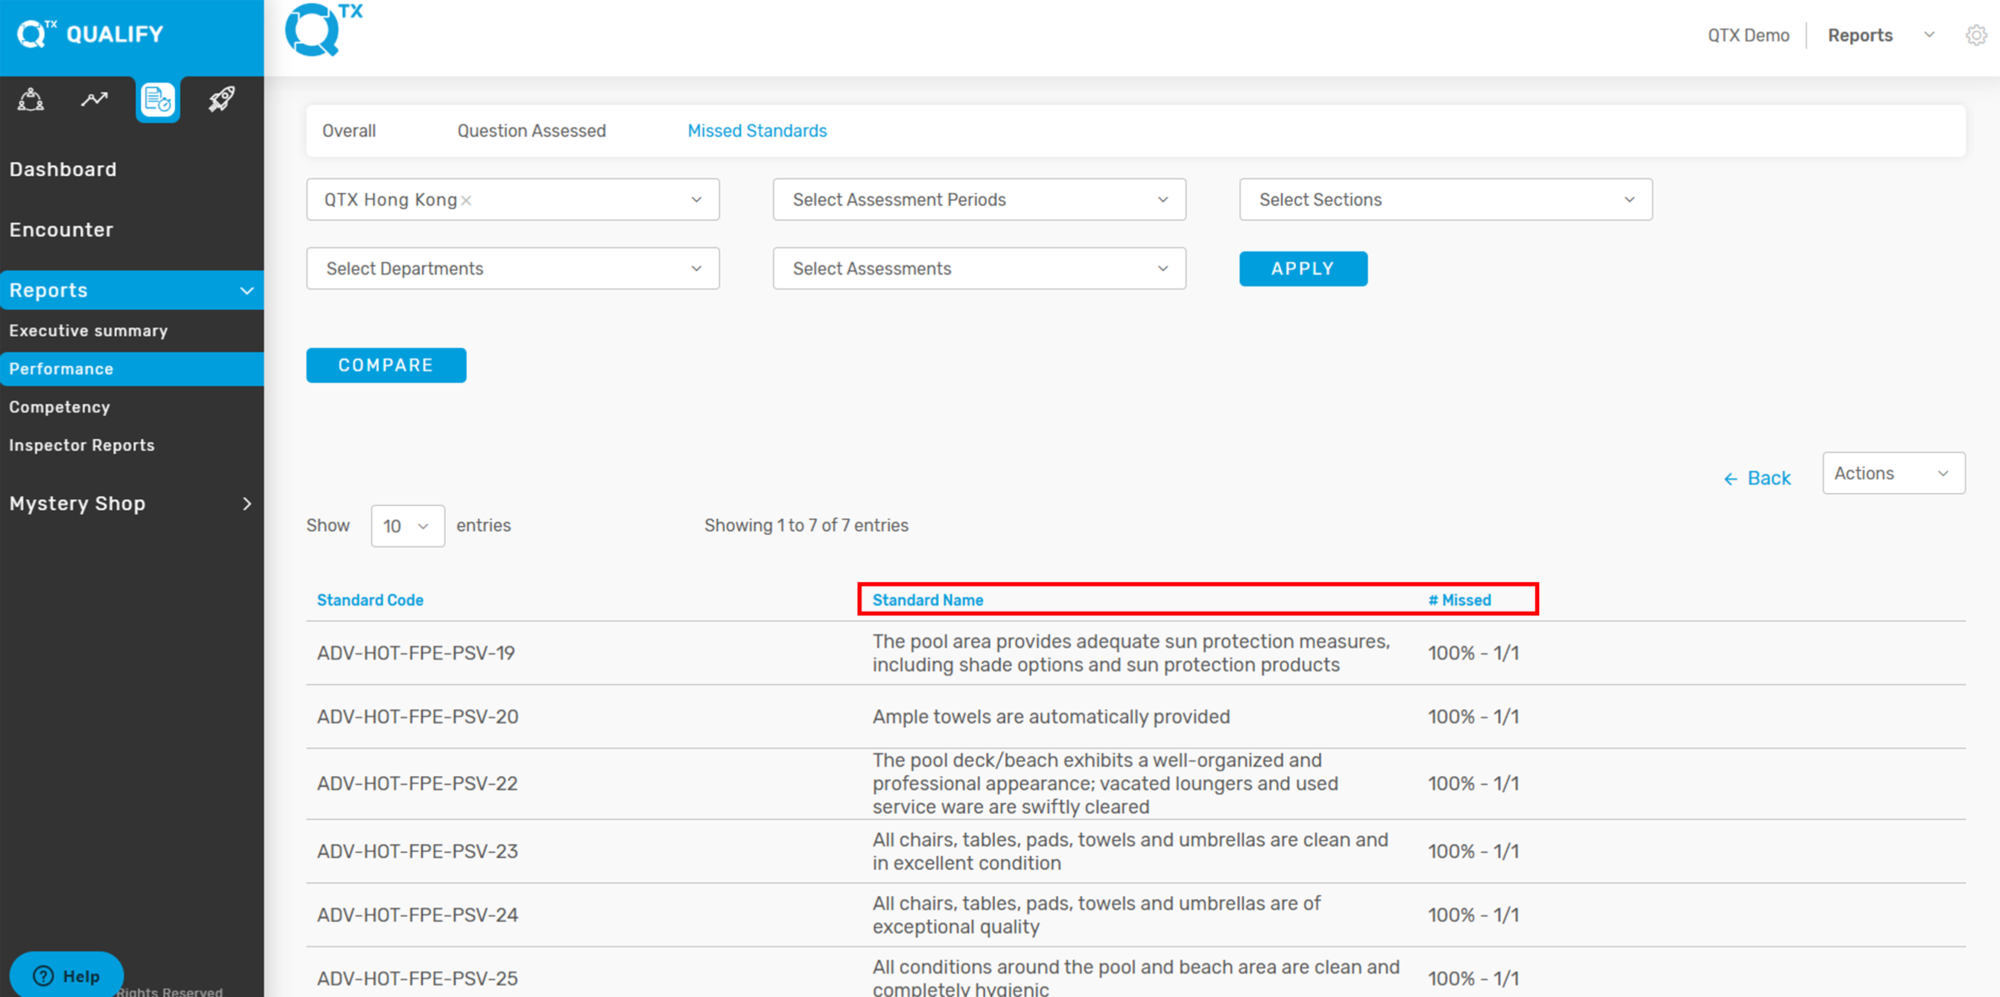
3. Click the “Missed Standards” tab to access the relevant section. Then, use the selection list to filter and choose the specific information you want to view. And click the “Apply” button.


4. The report will display the total of missed standards by number and percentage, based on the selected Assessment Name.


5. Click on any Assessment Name, and the list of missed standards per standard will be displayed as shown below.


If you need further assistance, please send an email to helpdesk@q-tx.com

Qualify: How to View Summary of Questions Assessed

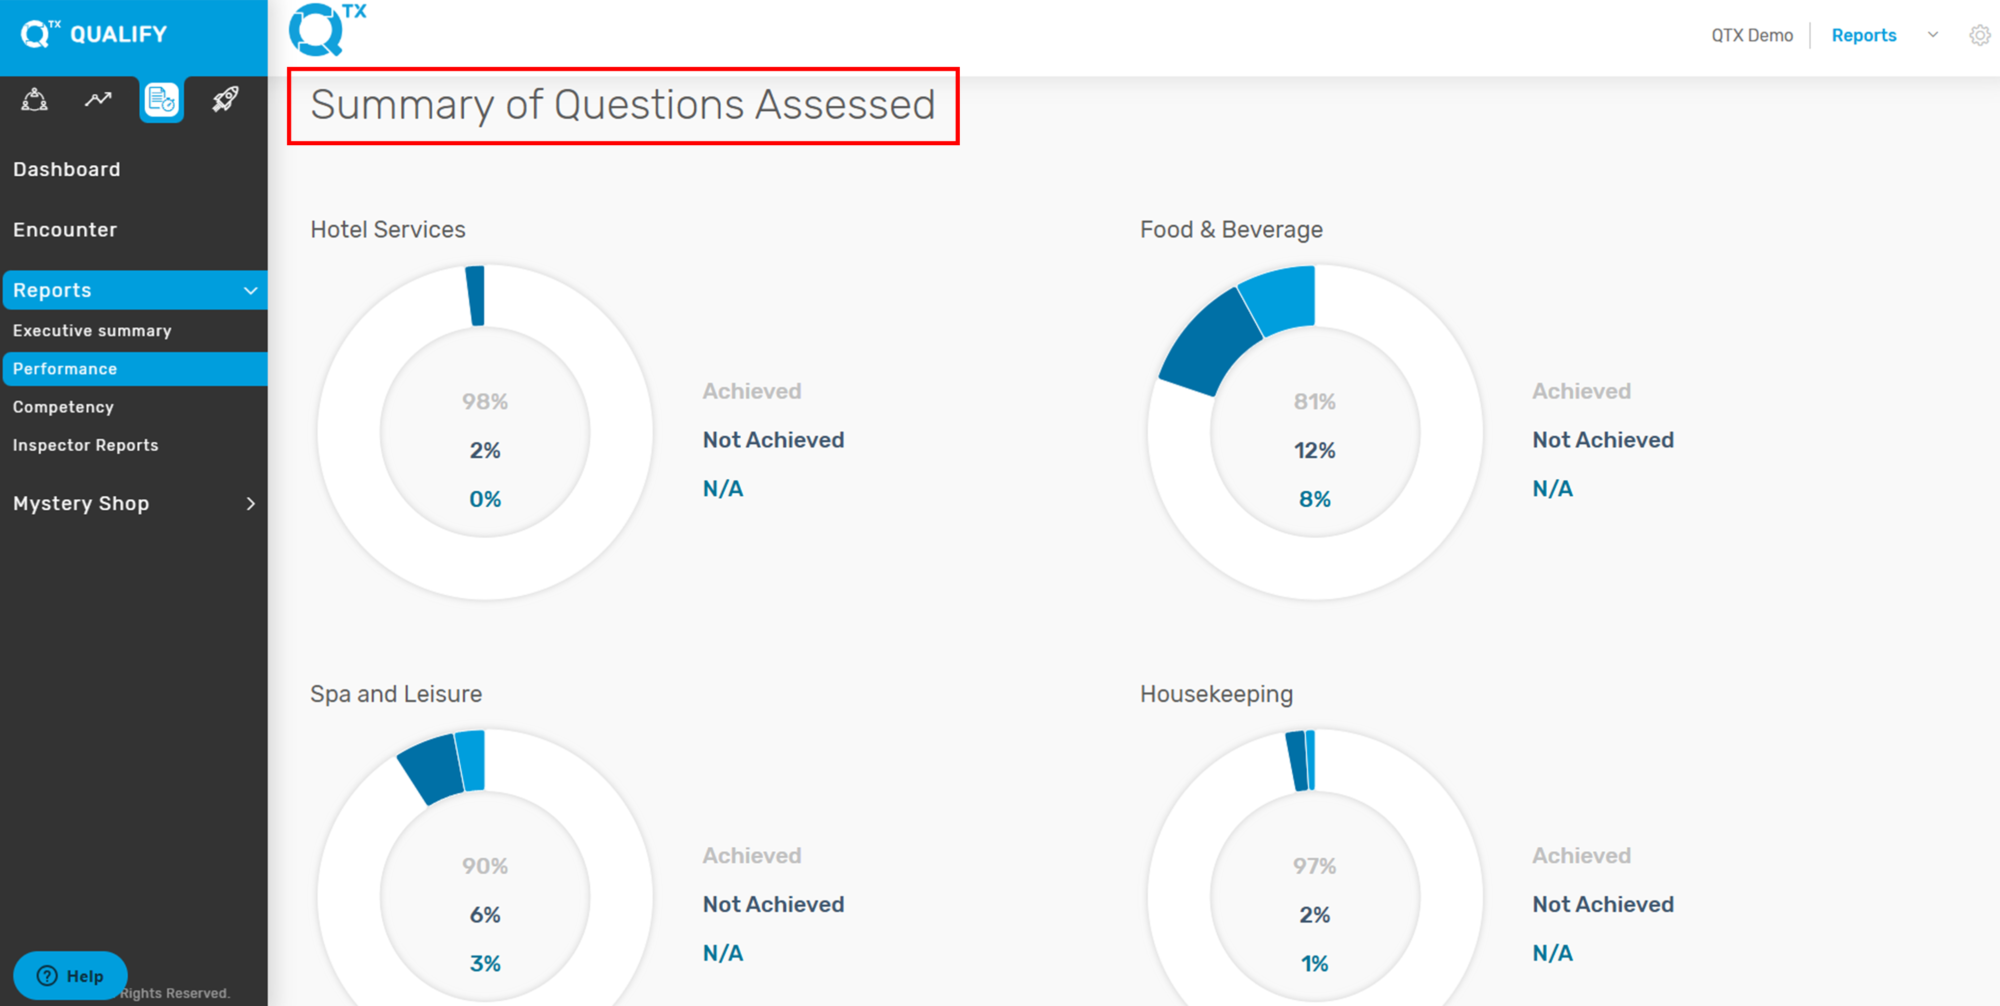
This displays a summary of the questions that have been achieved and not achieved by the department. The percentage score is presented in both pie chart and table formats.


1. On the Dashboard landing page, click the “QUALIFY” button to proceed.


2. Click on the “Reports” button, then select “Performance”.


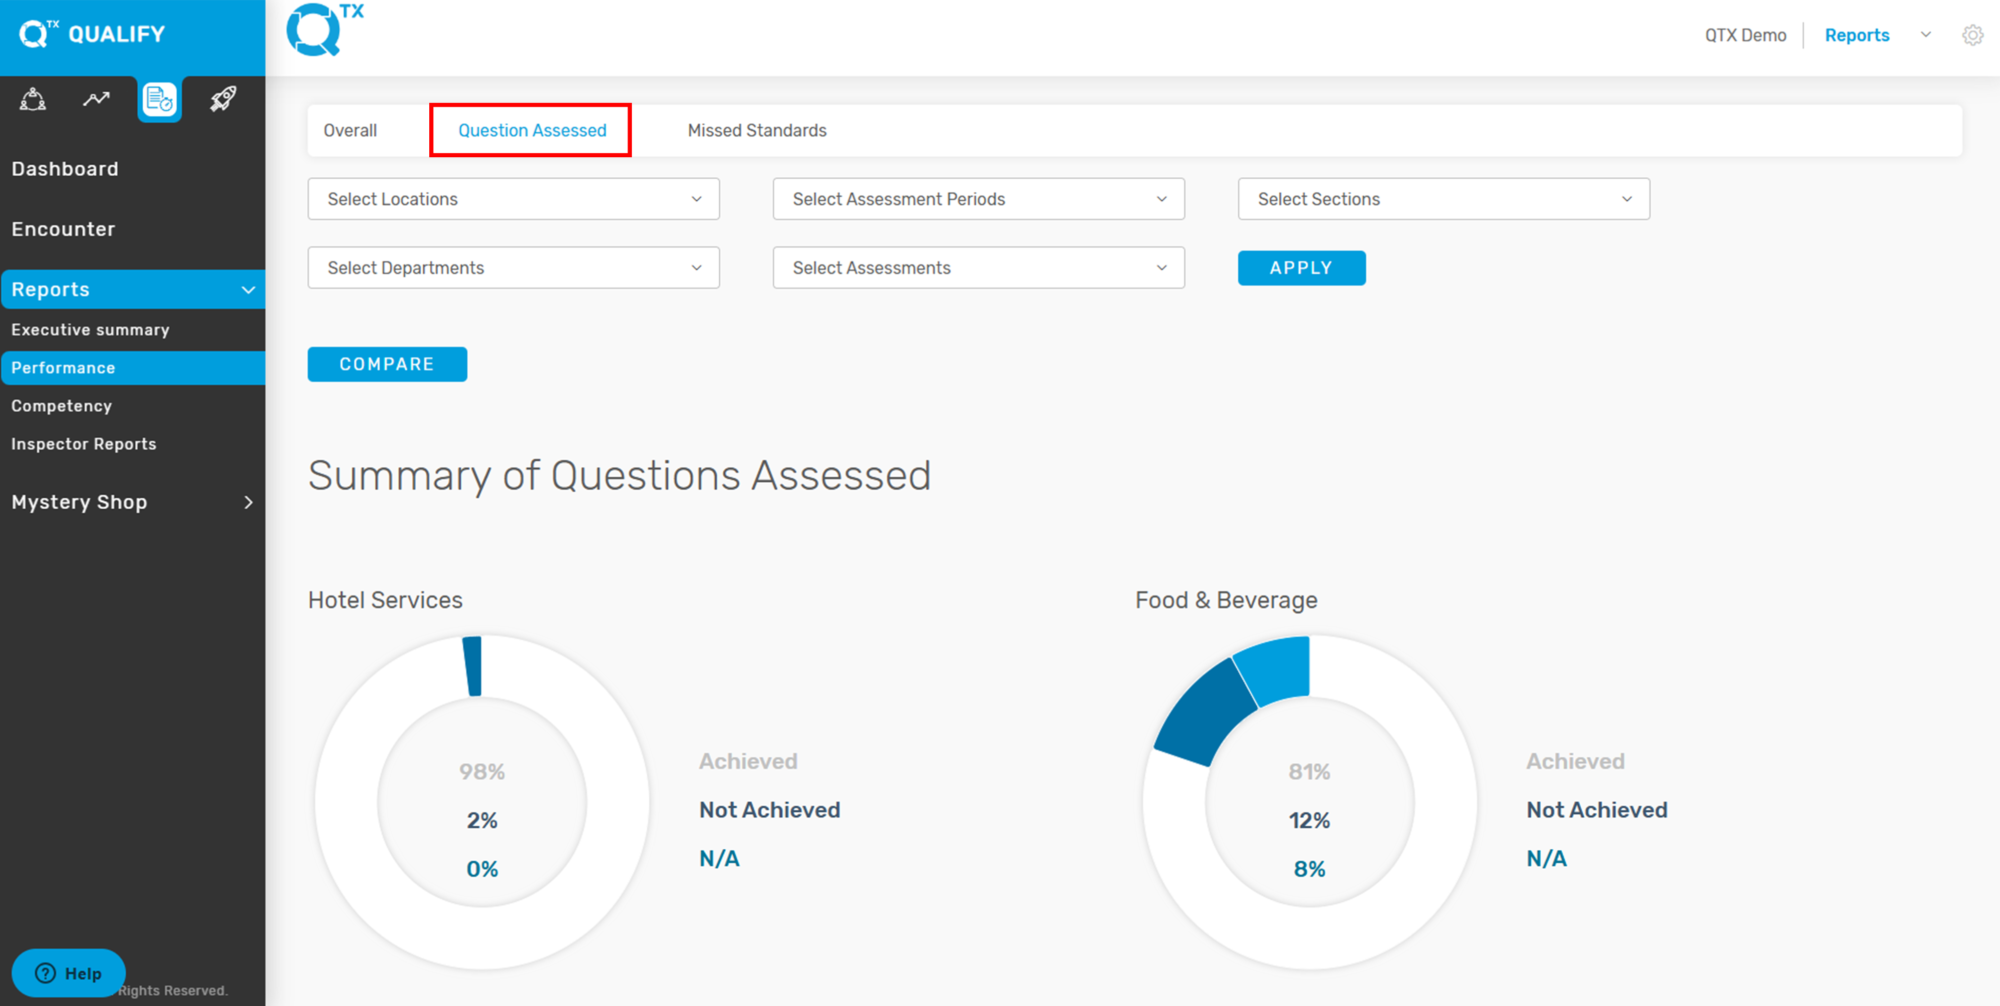
3. Click the “Question Assessed” Tab. Then, use the selection list to filter and choose the specific information you want to view.


4. The system will display a summary of the assessed questions as a percentage, shown in a pie chart.


5. This table helps provide a clear overview of how each department performed in its assessments. By showing the percentage of Achieved, Not Achieved, and N/A responses, it allows users to quickly identify strengths and areas for improvement.

The N/A (Not Applicable) score is important because it indicates questions that were not relevant to the specific department or situation. These are excluded from the final performance calculation to ensure the score accurately reflects only the applicable criteria. This prevents departments from being unfairly scored on items outside their scope of responsibility.


If you need further assistance, please send an email to helpdesk@q-tx.com
Qualify: How to View the Overall Performance Report

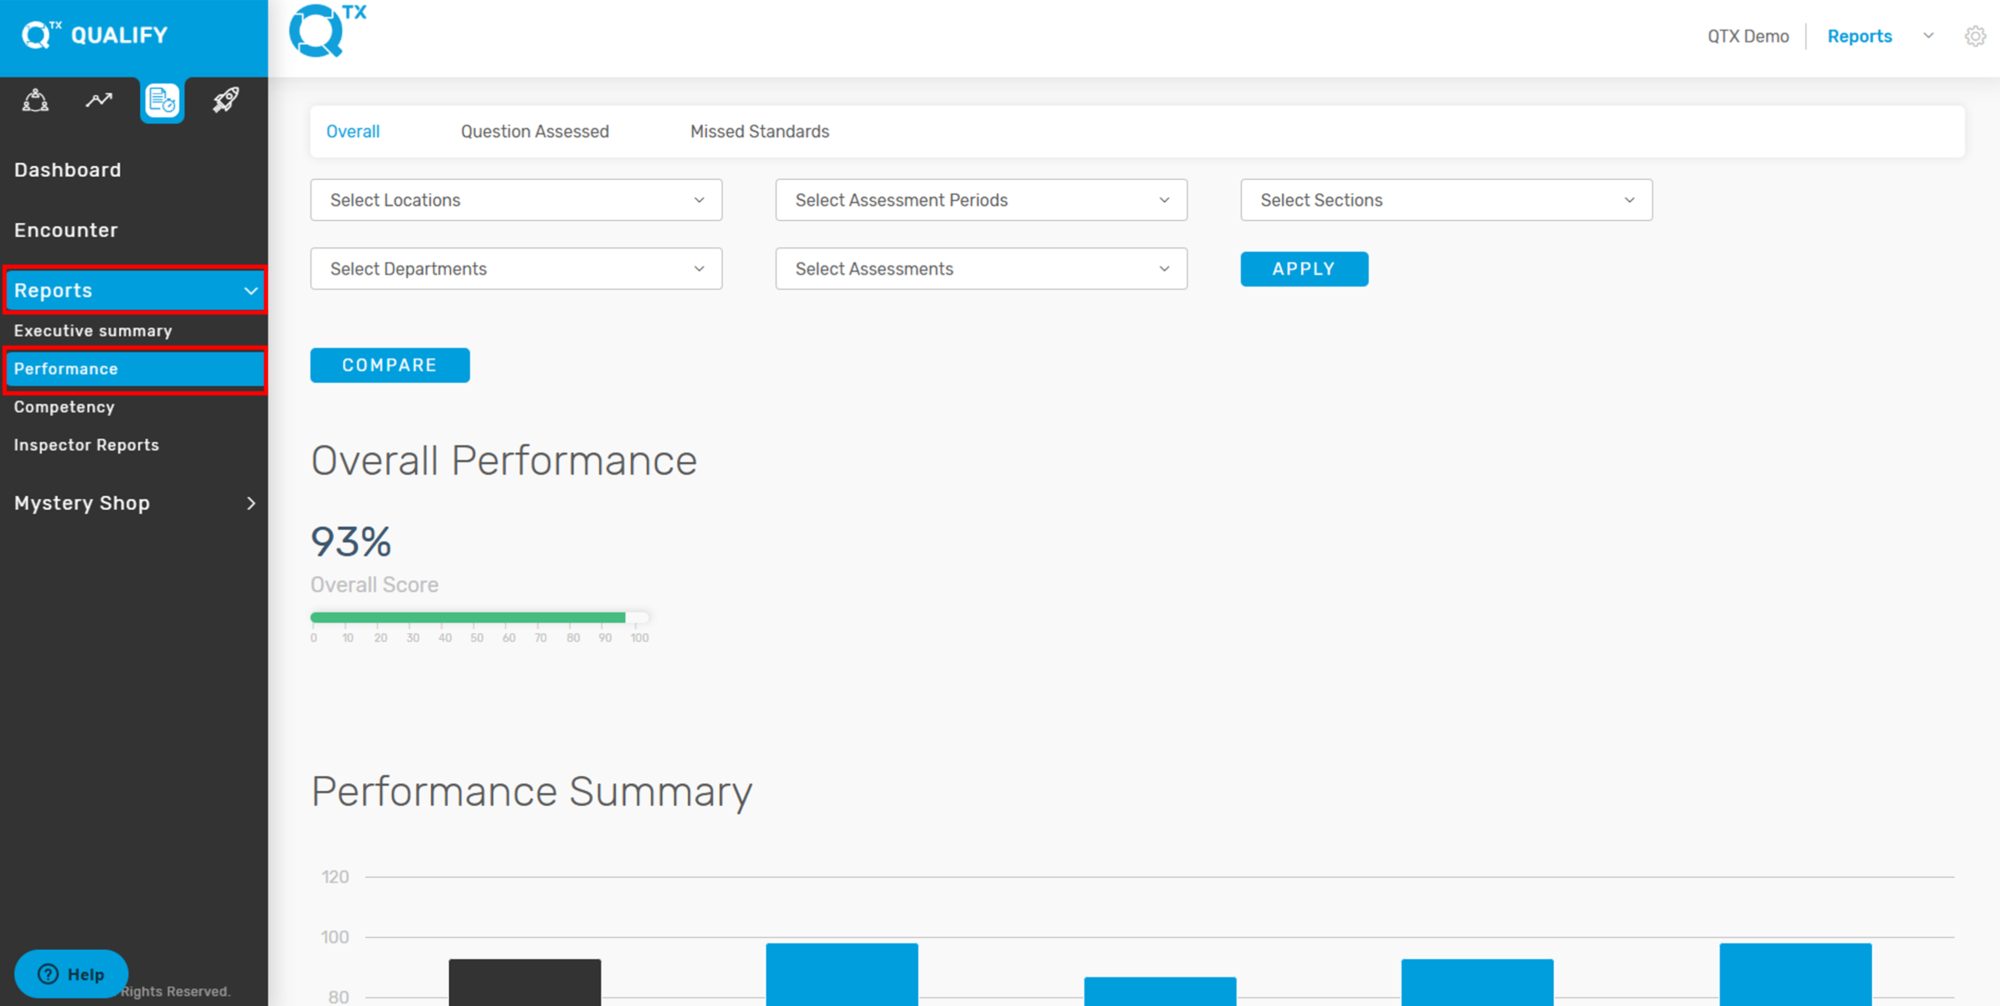
The Performance Report enables management to provide positive feedback and identify areas for improvement. It also allows departments to review results collaboratively and develop action plans to enhance skills and performance.


1. On the Dashboard landing page, click the “QUALIFY” button to proceed.


2. Click on the “Reports” button, then select “Performance”.


3. The system will redirect you to the ‘Overall’ tab. From there, select the relevant information from the dropdown list to apply filters.


4. The Overall Performance score is displayed as a percentage and shown in a graph format. Hover your cursor over a bar in the graph to view the exact Overall score.


If you need further assistance, please send an email to helpdesk@q-tx.com

Qualify: How to View the Overall Score of Assessment Period in Encounter

Displaying the Overall Score as a percentage helps determine the department’s achievements during a specific assessment period. The inspector evaluates the department’s service performance based on standardized rating scales.


1. On the Dashboard landing page, click the “QUALIFY” button to proceed.


2. Click the ‘Encounter’ button, then select the relevant information and click the ‘Apply’ button to filter.


3. The Overall Score is displayed as a percentage based on the selected assessment period.


If you need further assistance, please send an email to helpdesk@q-tx.com

Qualify: How to View List of Available Locations as a Group User

Location refers to the specific property or hotel where the tailor-made mystery shopping assessment takes place. This is the physical site selected to evaluate how well the service delivery aligns with brand standards and expectations. Each location is assessed individually to ensure the accuracy and relevance of the findings, helping management understand performance at the property level and identify opportunities for improvement.


1. On the Dashboard landing page, click the “QUALIFY” button to proceed.


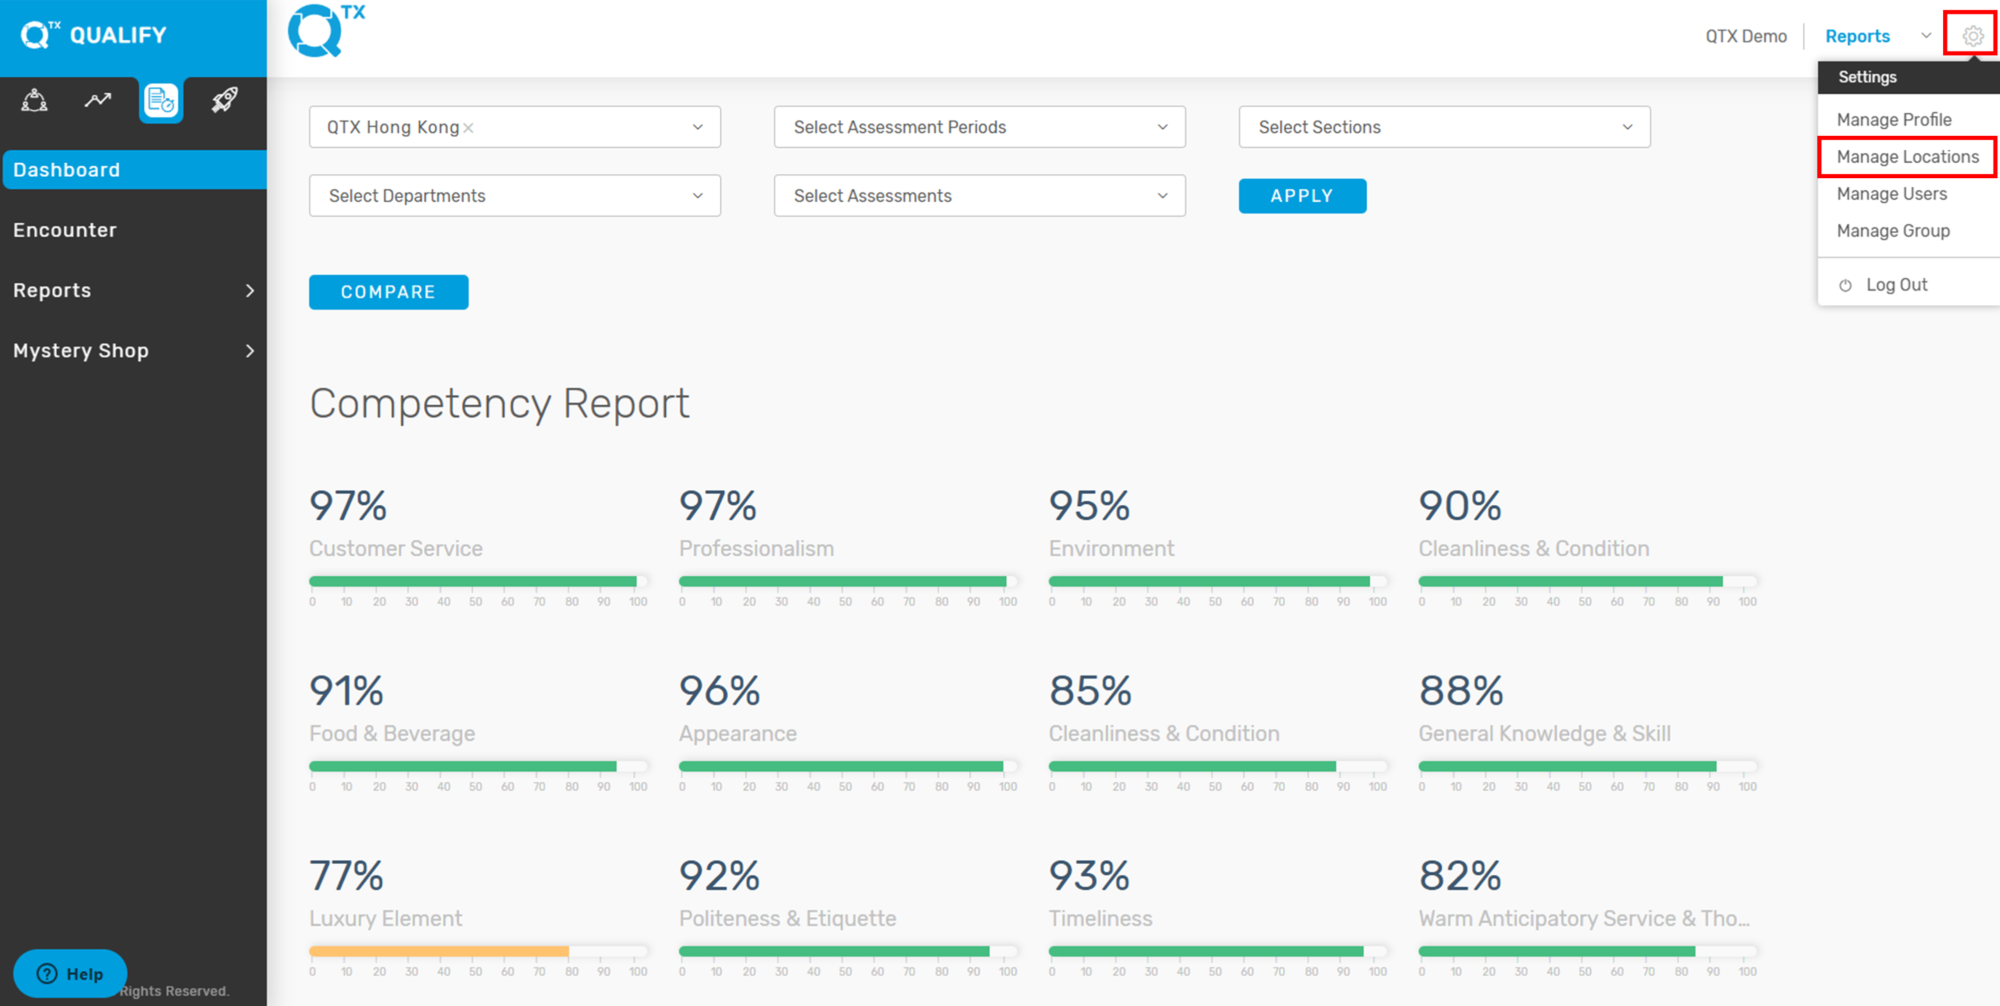
2. Click the settings icon in the top-right corner, then select ‘Manage Locations’.


3. The system will navigate to the ‘Location’ tab, where a list of Locations, Sections, and Departments will be displayed as shown below.


If you need further assistance, please send an email to helpdesk@q-tx.com
Qualify: How to Find the Competency/Subcompetency and Competency Code as a Group User

Each standard represents a specific category of the guest experience, referred to as a Competency or Subcompetency. These categories help organize the evaluation criteria into meaningful segments. By grouping standards under competencies, the assessment provides a structured view of performance, making it easier to identify strengths and areas for improvement within each aspect of the guest journey.


1. On the Dashboard landing page, click the “QUALIFY” button to proceed.


2. Click the settings icon in the top-right corner, then select ‘Manage Locations’.


3. Click the ‘Competency’ tab to view the list of Competencies along with their corresponding Subcompetencies and Codes.


4. You can change the language setting of the competency details, if another language is available. Additionally, you can upload data from an Excel file and view the total number of entries.


If you need further assistance, please send an email to helpdesk@q-tx.com
Connect: How to Choose to Show the Number of Decimal Points in Reports

This setting allows users to define the number of decimal points displayed in reports. Adjusting the decimal precision ensures numerical data is presented with the required accuracy, whether rounded for simplicity or shown in full detail for analytical purposes.


1. On the Dashboard landing page, click the “SETTINGS” button located in the upper-right corner.


2. Then, choose “Manage Profile” from the drop-down menu.


3. Here, you will see the account owner’s profile details along with the option to change the password.


4. At the bottom of the page, you can configure how numbers are displayed in the reports (e.g., number of decimal points) and also change the language.


If you need further assistance, please send an email to helpdesk@q-tx.com
Connect: How to Find / View the Key metrics as a Group User

Key Performance Indicators (KPIs) are essential metrics for a business. They provide measurable statistics that reflect the performance of an organization or department. All organizations, from nonprofits to multinational corporations, need to track these metrics to gain an accurate picture of their operations. By reviewing key metrics, organizations can obtain insights that would otherwise require a complex analysis of large amounts of data.


1. On the Dashboard landing page, click the “SETTINGS” button located in the upper-right corner.


2. Then, choose “Manage Locations” from the drop-down menu.


3. The system will take you to the default view. Click on the “KEY METRICS” tab. From here, you can add new key metrics based on the aligned business requirements.


If you need further assistance, please send an email to helpdesk@q-tx.com

Connect: How to View Monthly Report

The Monthly Report compiles feedback and insights from guest experiences at the hotel. It serves as a key tool in evaluating service standards, identifying trends, and ensuring consistency in the quality of hospitality provided to guests. This report supports continuous improvement by highlighting strengths and addressing areas that require attention.


1. On the Dashboard landing page, ensure you are in the Connect Platform. Then, click on REPORTS – MONTHLY REPORT. Use the FILTER option to fill in and complete all the required information.


After applying the filter, scroll down to view the Overall Satisfaction, Global Score, and Response Rates.


List of Key Metrics, including the Number of Responses


The Top 5 Areas represent the departments or outlets with the highest satisfaction rates, while the Bottom 5 Areas represent those with the lowest satisfaction rates.


2. Here, you can view the data related to Problem Resolution.


Guest Demographics refers to the statistical characteristics of hotel guests, such as age, gender, nationality, place of origin, purpose of stay (business or leisure), and other background information. These details help the hotel understand its guest profile, identify trends, and tailor services to meet guest needs more effectively.


This data shows the Commentary Statistics Report for each department or outlet, along with the total number of comments.


If you need further assistance, please send an email to helpdesk@q-tx.com

Connect: How to View Survey Templates

On this platform, you can view the list of available survey templates, including After Stay Surveys, General Surveys, and Outlet Surveys. These templates are designed to gather valuable feedback from guests at different touchpoints of their experience. The After Stay Survey helps capture insights on overall satisfaction after a guest’s visit, the General Survey provides feedback on broad service areas, and the Outlet Survey focuses on specific departments or facilities such as restaurants, spa, or other outlets. Using these templates ensures consistency in data collection and allows the hotel to monitor guest experiences across various service areas.


1. When you are on the Dashboard landing page, ensure you are in the Connect Platform and click on the SURVEY BUILDER tab. This section allows you to create, customize, and manage survey templates tailored to different guest experiences. You can design questions, adjust formats, and select specific survey types (After Stay, General, or Outlet) to gather the most relevant feedback for your needs.


After Stay Survey – This survey is conducted after the guest has departed. It is designed to gather feedback on the overall experience, including satisfaction with services, facilities, and staff interactions, helping the hotel identify strengths and areas for improvement.


General Survey – This survey is sent to guests who have recently stayed at the hotel. It captures feedback on their stay experience, covering key aspects such as service quality, amenities, and overall satisfaction, providing valuable insights for continuous improvement.


Outlet Survey – This survey is designed to gather feedback on a guest’s experience in specific hotel outlets, such as restaurants, bars, or spas. It evaluates elements like food and beverage quality, service, ambiance, décor, and overall atmosphere, providing insights into how each outlet meets guest expectations.


If you need further assistance, please send an email to helpdesk@q-tx.com

Connect: How to View the list of Available Location as a Group User

The Location section in the Connect Platform Settings provides an overview of all the properties registered within the system. You will also be able to see the department associated with each location.


 1. From the Dashboard landing page, click on the “SETTINGS” button located in the upper right corner of the screen.


2. After clicking the Settings icon, choose “Manage Locations.


3. The system will take you to the Connect Platform Settings. Click on the “LOCATION” tab, then scroll down until you reach the list of available locations.


If you need further assistance, please send an email to helpdesk@q-tx.com

Connect: How to View Satisfaction Rate and Global Score of Owned vs. Leased Outlet

The QTX system provides a detailed Satisfaction Rate and Global Score for both Company-owned and Leased outlets, displayed separately in graph and table formats. It also includes a performance indicator that helps departments and management evaluate success in achieving specific targets.

  • Satisfaction Rate measures the percentage of positive responses from guests or users based on their direct feedback. This reflects how well the service, product, or experience met or exceeded expectations. A high Satisfaction Rate indicates strong performance in guest engagement, service quality, and operational consistency, while a lower rate highlights areas that require improvement.

  • Global Score is a comprehensive performance index that combines multiple evaluation criteria—including service standards, compliance checks, and overall guest experience—into a single score. Unlike the Satisfaction Rate, which is primarily guest-driven, the Global Score provides a broader, balanced perspective by integrating both guest feedback and operational standards. This allows management to identify trends, benchmark results across different outlets, and track progress against strategic goals.

By comparing both indicators, organizations gain deeper insights: the Satisfaction Rate highlights customer sentiment, while the Global Score reflects the overall operational and service excellence.


1. On the Dashboard landing page, click Reports under the CONNECT platform, then select Response Analyses.


2. Fill in the required filter details, then generate and view the report.


3. You will be directed to the Performance tab. Click Performance, then select Owned vs Leased Outlet, and choose Satisfaction Rate or Global Score.


4. The Overall Satisfaction Rate graph will be displayed. Hover your cursor over any bar in the graph to view the exact percentage score.


5. Next, the system will display the Overall Owned Outlets graph. Hover your cursor over any bar to view the exact percentage score for each outlet.
Click the VIEW MORE button to display the table view of each outlet.


6. The next section displays the Owned Outlet report with Key Metrics Scores by Department in a table format. This indicates if each department performance has increased or decreased.


8. Next, you can view the Leased Outlets report in a graph format, similar to the Owned Outlets display for your reference. Click VIEW MORE at the bottom to see additional details. (Image needs to be updated).


If you need further assistance, please send an email to helpdesk@q-tx.com

Connect: How to View Problem Resolution Report

This report tracks problems encountered during a guest’s stay and the team’s resolution rate. It provides users with complete information on guest responses related to problem handling and resolution.


1. On the Dashboard landing page, click Reports under the CONNECT platform, then select Response Analyses from the Reports menu.


2. Click the Problem Resolution tab, then complete the required filter information.


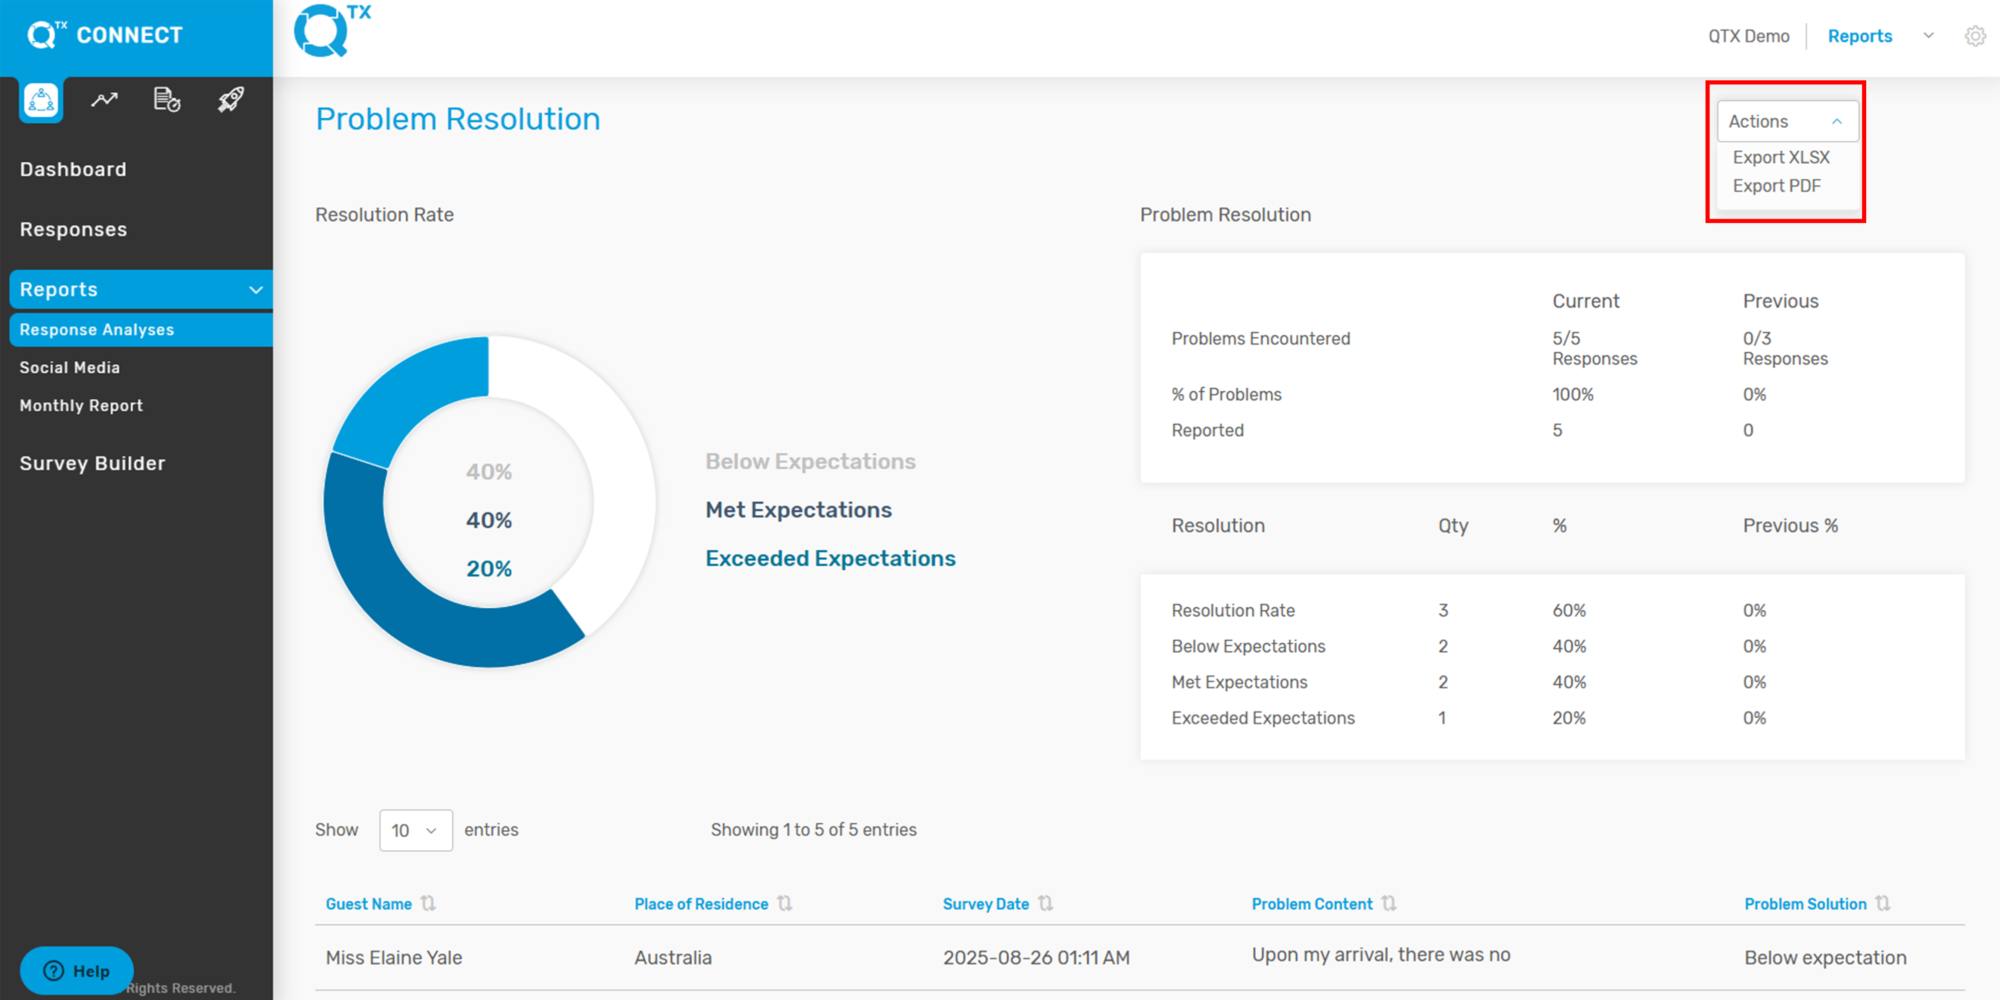
3. Problem Resolution measures the problems encountered during a stay and the corresponding resolution rate, shown in both numbers and percentages. You can also export the report by clicking the Action button and selecting either Export XLSX or Export PDF.


4. Guest names are displayed in a table format. The user can click on any entry to view the corresponding guest response.


6. The system will display the guest’s complete details as shown below. To respond to the guest by email, click the envelope icon.


7. The guest’s email address is automatically generated by the system. Simply enter the Subject and Message, then click SUBMIT when ready to send.


If you need further assistance, please send an email to helpdesk@q-tx.com
Connect: How to View/Select Distribution and Key Metrics on Response Analyses

In the Distribution and Key Metrics section, you can view important insights that summarize guest feedback and performance results. This feature allows you to see the overall satisfaction scores and the percentage ratings for each property.


1. After logging in, you will arrive at the Dashboard landing page. From here, click on the “REPORTS and RESPONSE ANALYSES” button. Next, select “DISTRIBUTION” to open the section where you can view response data and key metrics.


2. Scroll down to view all the available data under “Distribution Scores” and the “Distribution Graph.” If needed, you can also export the data by clicking on the Action button.


3. Scroll down further to find the “Key Metrics Score” section. This area displays the overall performance results based on specific metrics, such as satisfaction, service quality, or other defined indicators. The scores provide a quick overview of how each property is performing, making it easier to compare results and identify areas that may need attention.


If you need further assistance, please send an email to helpdesk@qtx.com

Connect: How to View Demographics Details on Response Analyses

On the Demographics page within Response Analyses, you can view detailed insights into guest feedback based on their Place of Residence. This section displays the number of responses, the corresponding satisfaction rates, and the global score for each location.


1. After logging in, you will arrive at the Dashboard landing page. On the left-hand side, click “REPORTS” and then select the “RESPONSE ANALYSES” button. Next, click on “DEMOGRAPHICS.”

Make sure to apply all the relevant details in the Filters to view accurate demographic data. Once the filters are set, scroll down to access and review all the data you need.


2. If you want to export data from the system, simply click on the “ACTIONS” button and select “Export XLSX.


3. Below the Guest Demographics section, you will find a table displaying the following details: Place of Residence, Surveys Sent, Responses Received, Response Rate, Satisfaction Rate, and Global Score.


If you need further assistance, please send an email to helpdesk@qtx.com

Connect: How to View/Select Commentary on Response Analyses

In the Commentary section, you can view the complete series of comments, explanations, and annotations provided by the guest. This feature allows you to review detailed feedback directly associated with their responses, giving deeper insights into the guest’s experience and sentiments.


1. After you log in, you will be taken to the Dashboard landing page. From the left-hand menu, click on “REPORTS”, then select “RESPONSE ANALYSES.” Next, click on “COMMENTARY” to view the full series of guest comments, explanations, and annotations linked to their responses.


2. Scroll down to view all guest comments along with the corresponding survey scores. You can also export the file by clicking on the Action button.


3. If you would like to view the Key Metrics and Problem Resolution, simply click on Comment. This will redirect you to the Guest Responses page.


If you need further assistance, please send an email to helpdesk@q-tx.com

Connect: How to View/Find Guest Name on Responses using Filters

To get the necessary details in the Connect, users must enter all important information accurately. This ensures the system can provide the correct guest responses.


1. Login and Go to Responses: After logging in, you will land on the Dashboard. Click the “Responses” tab to start accessing guest survey information.


2. Apply Filters: Enter all required information in the Filters section to narrow down your search and quickly find the most relevant guest details. You can also click the Hide button to hide any additional filters you don’t need.


3. Scroll down to see the Guest Name list. Click the name of the guest you want to view. This will open their Guest Responses, where you can review their feedback and details.


If you need further assistance, please send an email to helpdesk@qtx.com

Connect: How to View Performance Report

This report provides a detailed measurement of staff performance based on satisfaction levels and scores. It highlights the performance outcomes of a specific group or department, enabling management to identify areas of growth, monitor progress, and assess the overall performance of the organization.


1. When you are on the Dashboard landing page, click on “Reports” under the CONNECT platform.


2. Click on “Response Analyses” under Reports. Next, fill in the required details in the Filters section. Make sure you are on the “Performance” tab to proceed.


3. The system will first display the overall performance report, showing both the Satisfaction Rate and the Global Score.


4. The table below displays the scores for the key metrics, highlighting whether performance has improved or declined.


5. The information can be viewed by the selected number of entries. Hover your cursor over the “Response Ratio” box to display additional details in a pop-up box below.


6. Below, a table summarizes departmental performance, showing the Department, the corresponding Survey Question, and the most recent scores. It also compares results against previous data (Vs Prev.), indicates performance improvement or decline (P.I.), and shows the number of responses collected (# of R.).

This layout allows management to quickly assess guest satisfaction levels across key service areas such as Check-In Experience, Concierge Services, and Guest Room/Suite, while tracking performance trends over time.


If you need further assistance, please send an email to helpdesk@q-tx.com

Connect: How to Use Filters on Responses

This function helps users organize and structure valuable information in a clear and understandable way. By entering all required details in the Filters section, users can narrow down search results to find the most relevant guest information quickly. Filters allow you to sort by specific criteria such as date, guest type, or feedback category, making it easier to focus on the data you need.

1. On the Dashboard landing page, click the “Responses” button in the CONNECT platform to view guest information.


2. Click the drop down arrow to view and choose from the selection list. You can click the “x” to remove the chosen item or simply unchecked.


3. There are 3 types of survey: After Survey (AS), General Survey (GS) and Outlet Survey (OS).
Users can choose more than one survey.


4. Guest Response by Score: You can find guest responses using the scoring system, which ranges from 1 to 10.


5. Multiple Selections: Users can select more than one option, such as Department, Problem Resolution, etc. The system will instantly display a list based on the selected criteria.


6. This section provides important measurements and data points that help users track performance, monitor trends, and analyze guest responses effectively. Key metrics may include scores, feedback counts, department performance, and resolution rates, giving a quick overview of overall performance.


7. This section categorizes guest responses and data based on whether the department is owned by the property or leased. It helps users analyze performance, track issues, and compare feedback between different types of departments efficiently.


8. Guest Responses by Residence: You can also view guest responses based on their place of residence, allowing you to analyze feedback from different locations.


If you need further assistance, please send an email to helpdesk@q-tx.com

Connect: How to Export XLSX Or PDF File

Exporting a file allows the user to convert data from one file type into another format. Once the file is exported to the desired format (as indicated by its file name suffix), it can be opened and worked on in any application that recognizes and supports that format. A PDF format provides an electronic image of text, or text combined with graphics, that resembles a printed document and can be viewed, printed, and electronically transmitted.


1. After logging in, go to the Dashboard landing page. First, click Reports, and under Response Analyses, select the Problem Resolution tab.


2. Make sure to complete all the required information in the Filters section.


3. You can now click Actions to export the file in XLSX or PDF format. The exported file will then be displayed on your screen.


If you need further assistance, please send an email to helpdesk@qtx.com